Fig. 3.
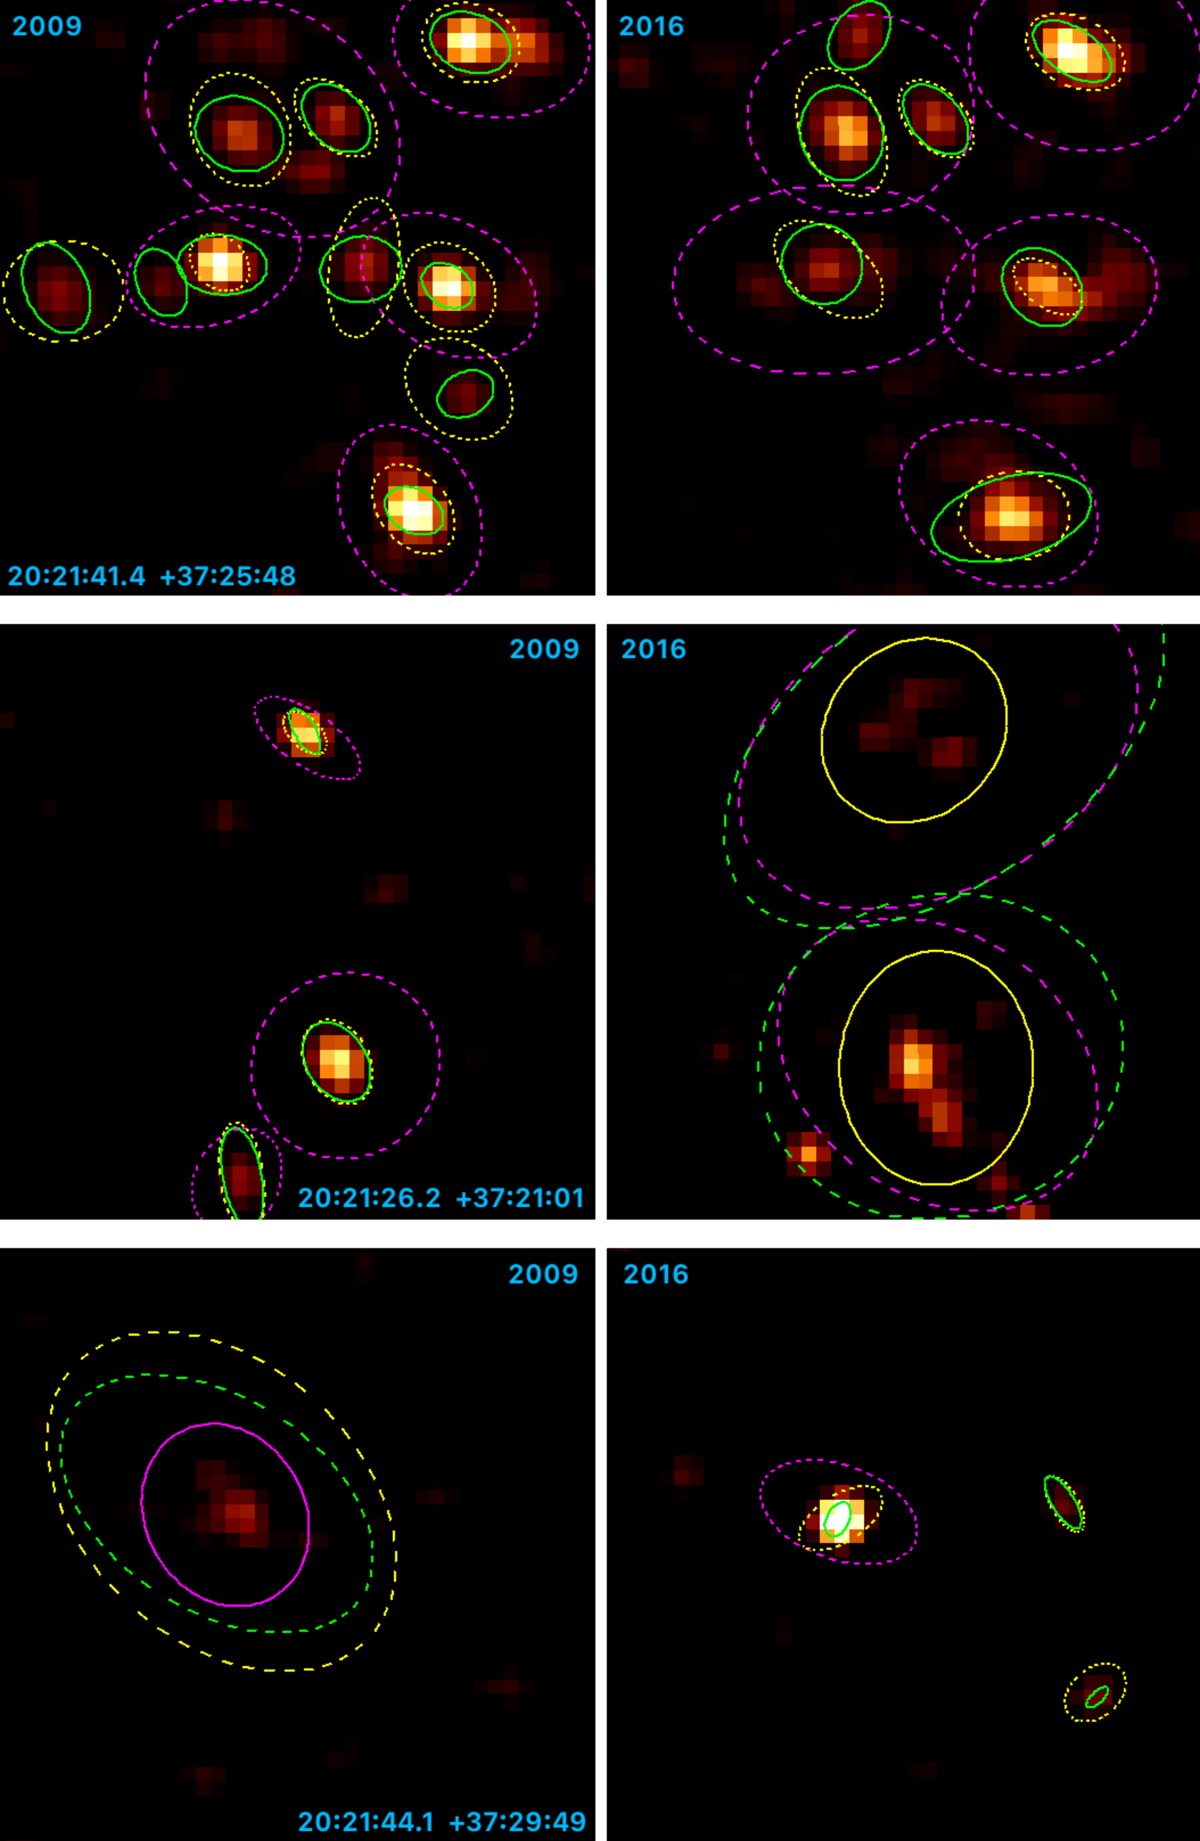
Comparison of X-ray detection ellipses in three 40″ × 40″ closeups, centered at the coordinates that are printed in blue, of the 2009 (left) and 2016 (right) Chandra/ACIS fields, using binning factors of 1 (green), 2 (yellow), and 4 (purple) pixels. Ellipses that were selected for the final source list are drawn with solid lines. The background images are 2-pixel binned. Upper panels: portion of the [DB2001] Cl05 cluster, middle panels: region near the edge of the 2016 field, and lower panels: region near the 2009 edge.
Current usage metrics show cumulative count of Article Views (full-text article views including HTML views, PDF and ePub downloads, according to the available data) and Abstracts Views on Vision4Press platform.
Data correspond to usage on the plateform after 2015. The current usage metrics is available 48-96 hours after online publication and is updated daily on week days.
Initial download of the metrics may take a while.