Fig. 2.
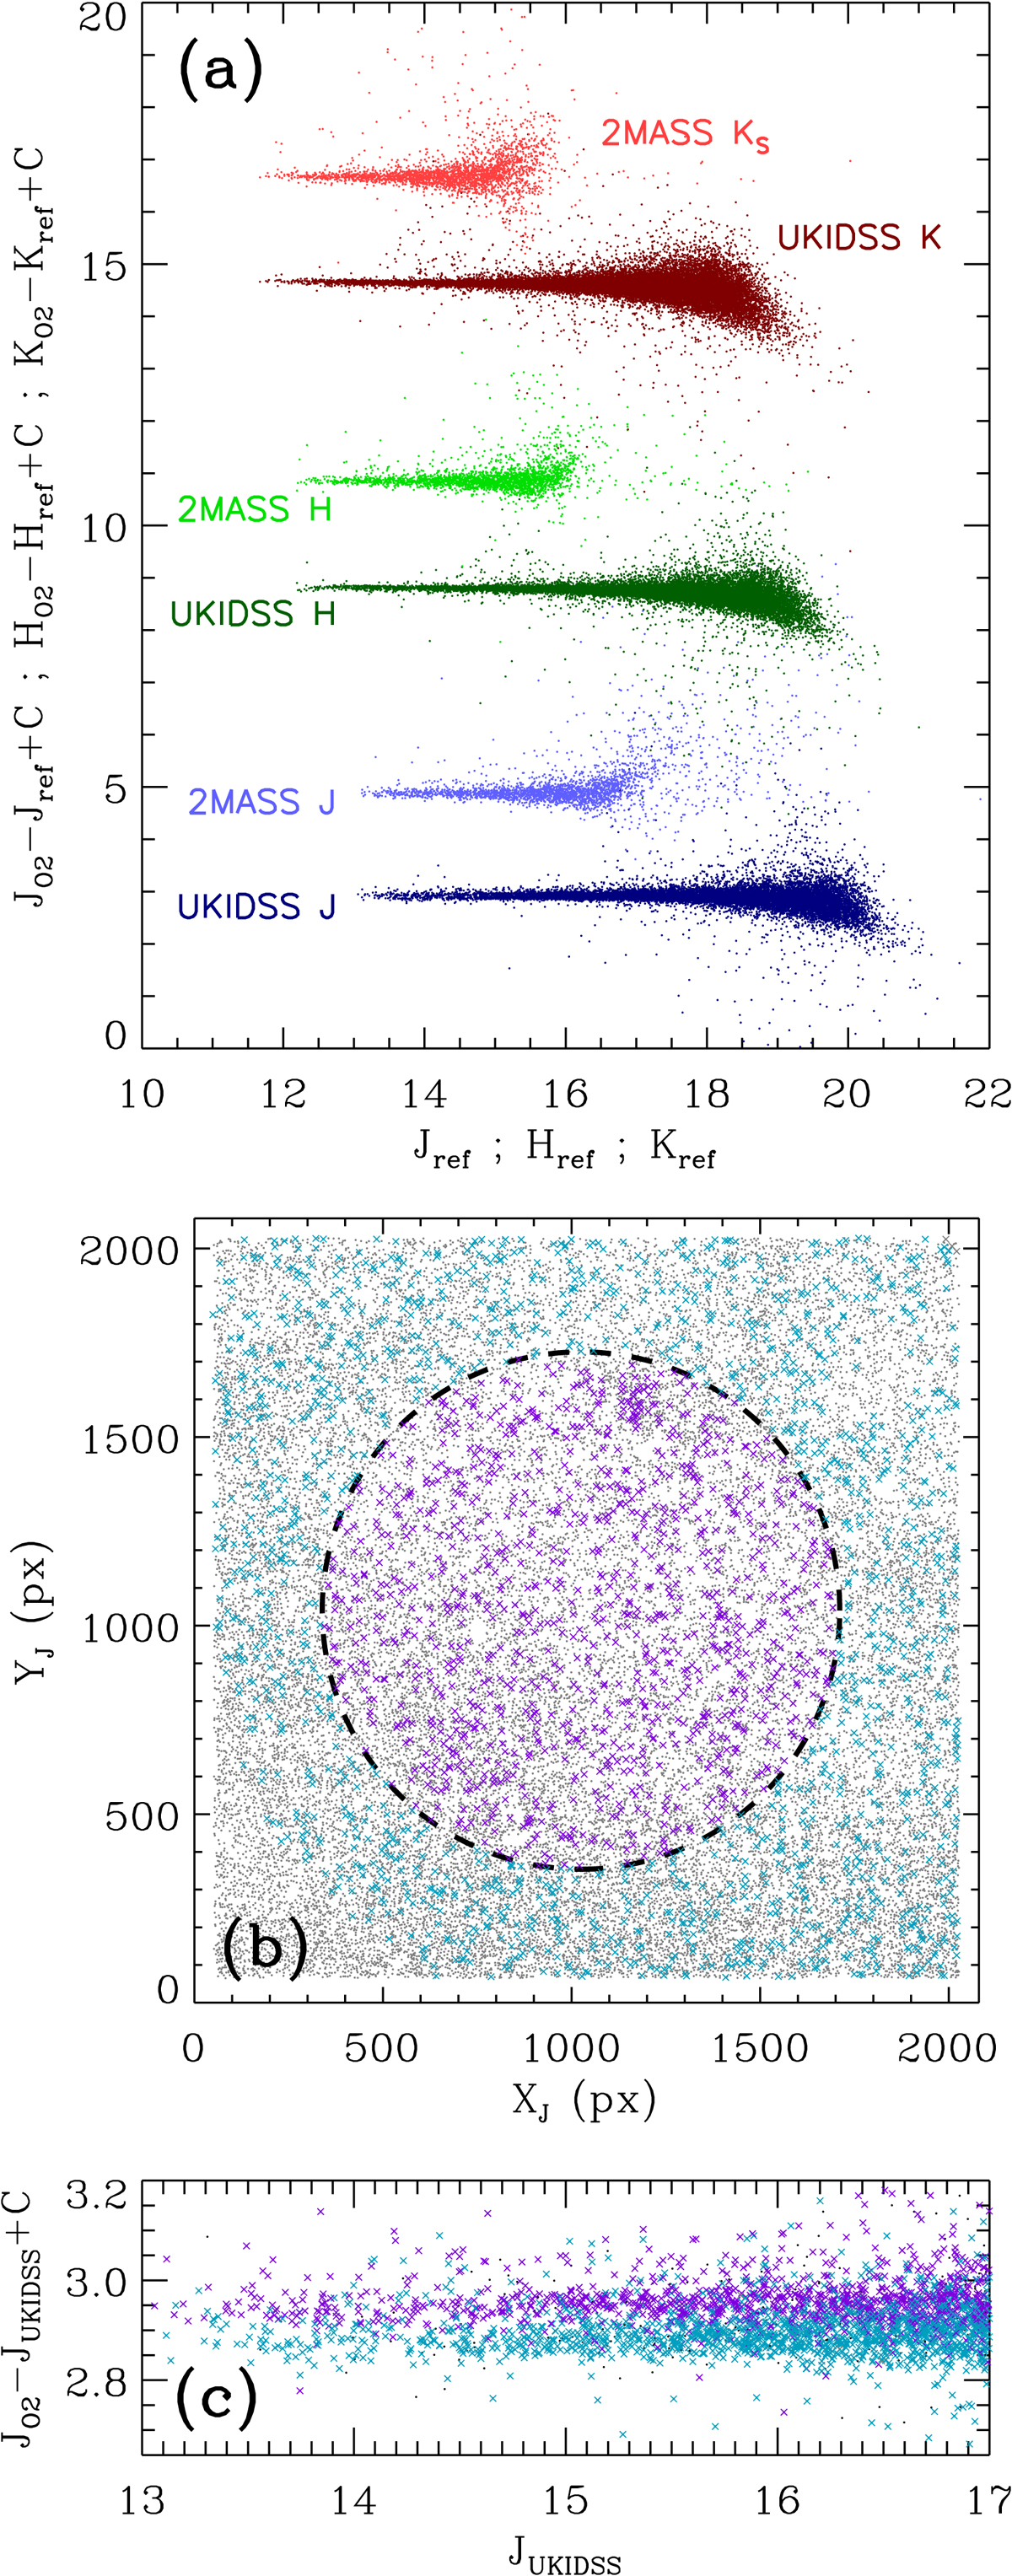
Photometric calibration of OMEGA2000 (“O2”) data. Panel a: comparison of calibration diagrams using 2MASS or UKIDSS as the reference (“ref”) survey. Panel b: location of J-band point sources (colored crosses: JUKIDSS < 17; σJ < 0.035) relative to the flat-field artifact, see Sect. 2.1. Panel c: close-up view of panel a showing the J-band bimodality; symbols are as in panel b.
Current usage metrics show cumulative count of Article Views (full-text article views including HTML views, PDF and ePub downloads, according to the available data) and Abstracts Views on Vision4Press platform.
Data correspond to usage on the plateform after 2015. The current usage metrics is available 48-96 hours after online publication and is updated daily on week days.
Initial download of the metrics may take a while.