Fig. B.1.
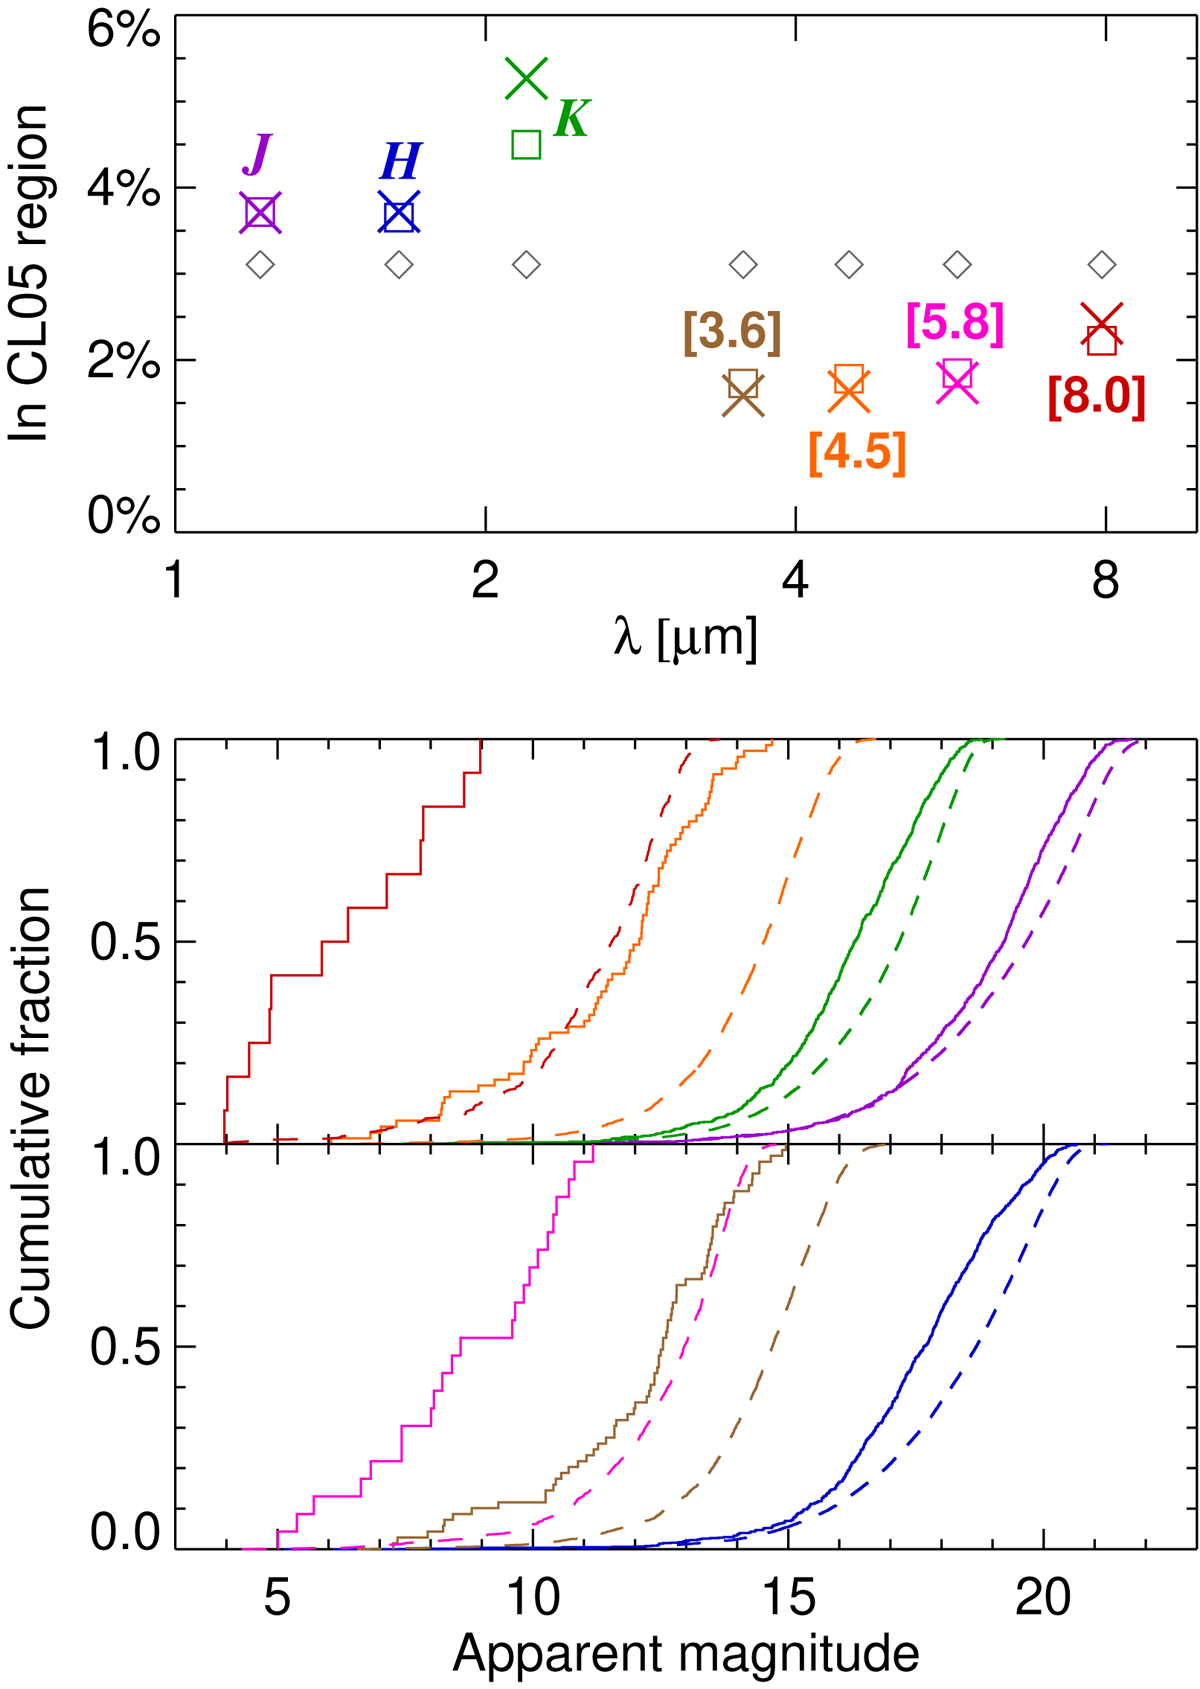
Illustration of selection biases affecting infrared photometry in the Cl05 region relative to the NIR+MIR region. Top: proportion of detections falling within the Cl05 region, as computed by considering all detections (squares), or only those meeting the corresponding uncertainty requirement for the G09 method (crosses). For comparison, the case of a spatially uniform distribution is shown as gray diamonds. Bottom: cumulative histograms of apparent magnitudes in the Cl05 region (solid lines) and the whole NIR+MIR region (dashed), using the same uncertainty-limited sample as for the crosses in the top panel and the same color code.
Current usage metrics show cumulative count of Article Views (full-text article views including HTML views, PDF and ePub downloads, according to the available data) and Abstracts Views on Vision4Press platform.
Data correspond to usage on the plateform after 2015. The current usage metrics is available 48-96 hours after online publication and is updated daily on week days.
Initial download of the metrics may take a while.