Fig. 9
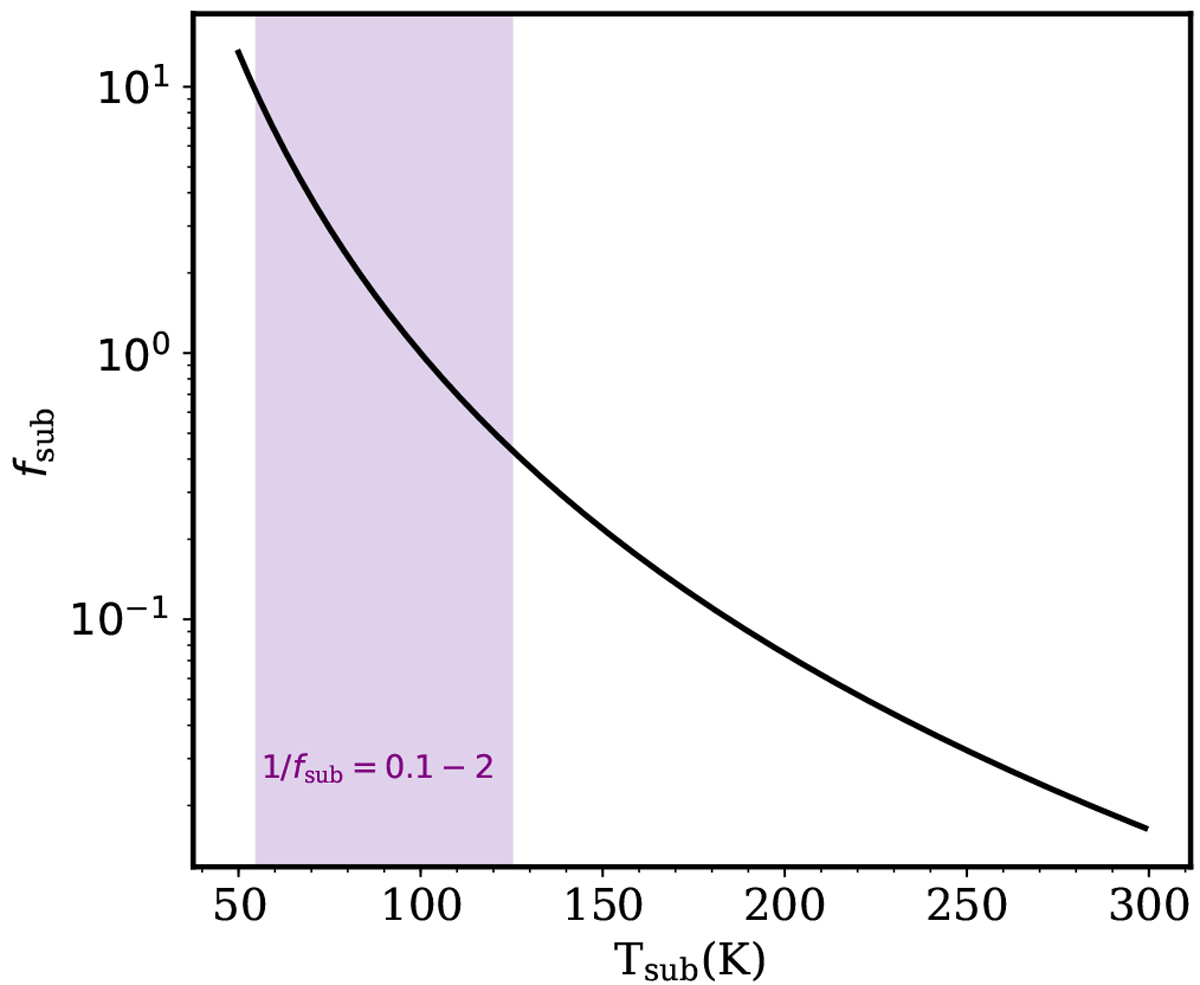
Correction factor, fsub, introduced in Eq. (4) due to different emitting areas arising from the sublimation temperature. The shaded area shows where most of the species considered in this work fall on this graph (sublimation temperatures between 55 K and 125 K).The abundance ratios of these species with respect to methanol are found by multiplying their column density ratios with respect to methanol by a factor of between 0.1 and 2.
Current usage metrics show cumulative count of Article Views (full-text article views including HTML views, PDF and ePub downloads, according to the available data) and Abstracts Views on Vision4Press platform.
Data correspond to usage on the plateform after 2015. The current usage metrics is available 48-96 hours after online publication and is updated daily on week days.
Initial download of the metrics may take a while.