Fig. 4
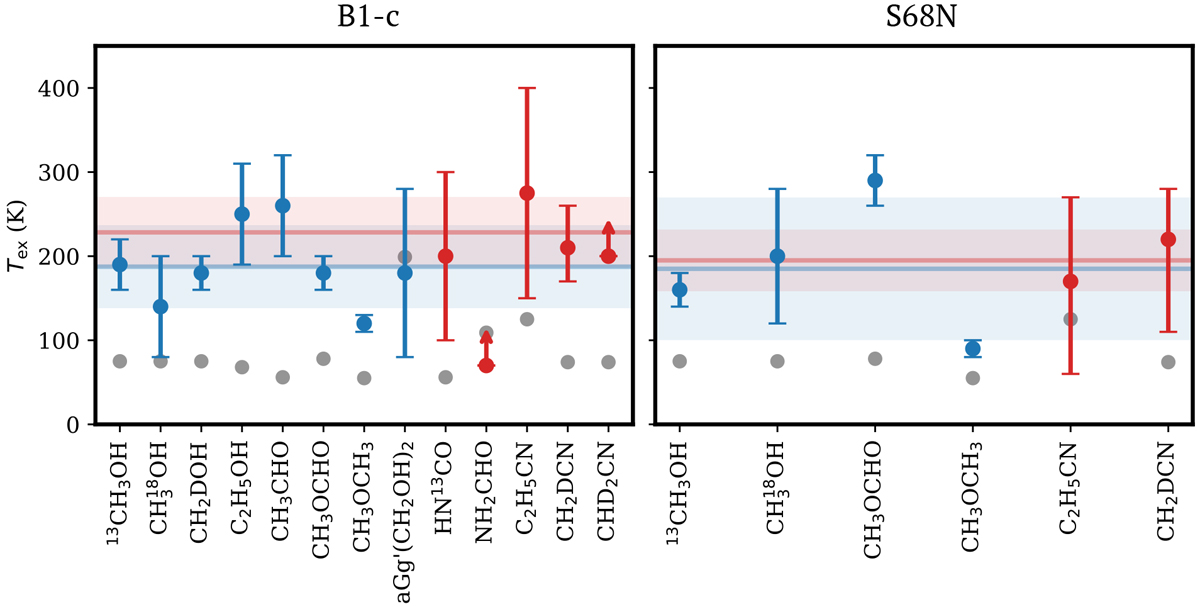
Excitation temperatures for N-bearing species discussed in this work (red) and O-bearing species discussed in van Gelder et al. (2020) (blue) for B1-c and S68N. Only the species with derived Tex are plotted. The solid red and blue lines show the average values for the red and blue data points, respectively. The shaded red and blue areas show the standard deviation of the data points. The grey points show the sublimation temperatures of the corresponding molecules found by the gas-grain balance model (Hasegawa et al. 1992) and the respective binding energies of each molecule (Penteado et al. 2017; Garrod 2013).
Current usage metrics show cumulative count of Article Views (full-text article views including HTML views, PDF and ePub downloads, according to the available data) and Abstracts Views on Vision4Press platform.
Data correspond to usage on the plateform after 2015. The current usage metrics is available 48-96 hours after online publication and is updated daily on week days.
Initial download of the metrics may take a while.