Fig. C.28
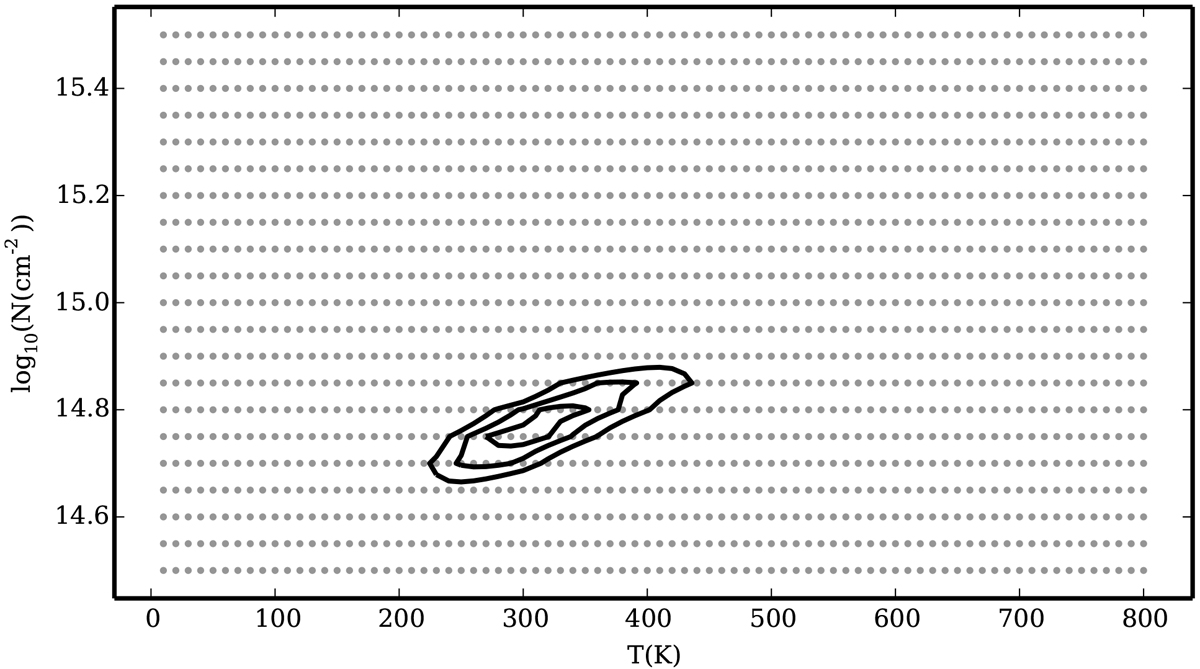
χ2 plot for C2H5CN for B1-c in the Band 5 and 6 data. The dots in the background show the grid used for this molecule, and the contours show the 3σ, 2σ, and σ levels of the best fit. It is seen that Tex is constrained to between ~200 K and ~ 400 K, whereas the column density is well determined at (5.8 ± 1.7) × 1014. We note that the vibrational correction factor is not taken into account for this plot.
Current usage metrics show cumulative count of Article Views (full-text article views including HTML views, PDF and ePub downloads, according to the available data) and Abstracts Views on Vision4Press platform.
Data correspond to usage on the plateform after 2015. The current usage metrics is available 48-96 hours after online publication and is updated daily on week days.
Initial download of the metrics may take a while.