Fig. 3
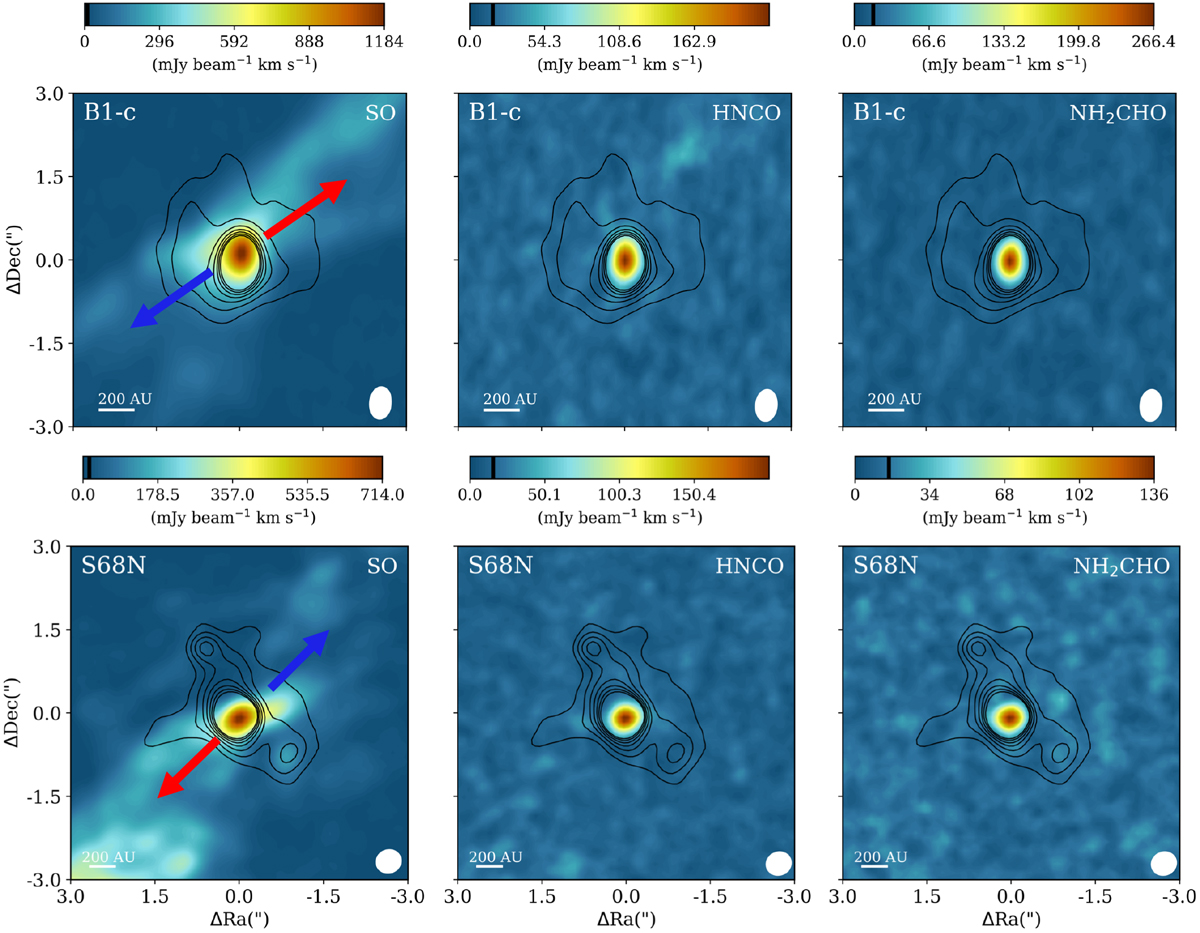
Moment zero maps of the lines of SO 67−56 (Eup = 47.6 K), HNCO 120,12−110,11 (Eup = 82.3 K), and NH2CHO 131,13 − 121,12 (Eup = 91.8 K) (from left to right) for B1-c (top row) and S68N (bottom row) in the Band 6 data. The images are made by integrating over [−10, 10] km s−1 with respect to Vlsr. The black contours show the continuum in levels of [15, 30, 45, 60, 75, 90, 105] σcont with a σcont of 0.2 mJy beam−1 for B1-c and [30, 45, 60, 75, 90, 105, 120] σcont with a σcont of 0.09 mJy beam−1 for S68N. The beam size is shown at the right-hand side of each panel. SO traces the extended outflow, while the other two molecules show compact emissions. The approximate directions of the blueshifted and redshifted emission of the outflow are shown with blue and red arrows.
Current usage metrics show cumulative count of Article Views (full-text article views including HTML views, PDF and ePub downloads, according to the available data) and Abstracts Views on Vision4Press platform.
Data correspond to usage on the plateform after 2015. The current usage metrics is available 48-96 hours after online publication and is updated daily on week days.
Initial download of the metrics may take a while.