Fig. C.1
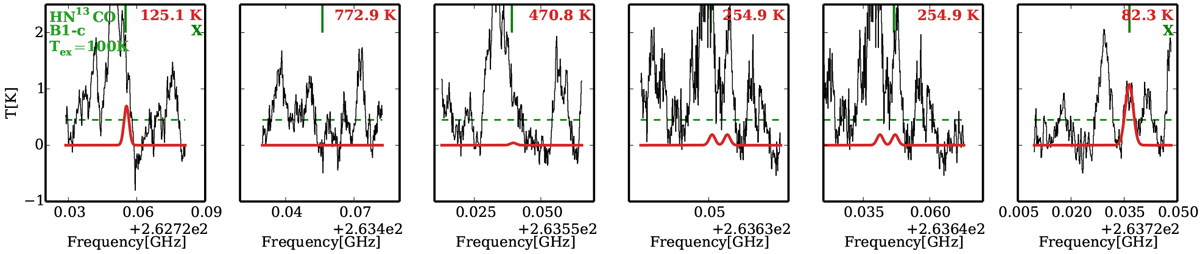
Model to combined Band 5 and 6 data of HN13CO for B1-c in red and data in black. The model uses the lower limit on the excitation temperature of HN13 CO. Each graph shows one line of HN13CO, indicated by the solid green line at the top of the box, along with its upper energy level, written in red at the top right. The lines with upper energy levels above 1000 K and/or Aij below 10−5 are not plotted. The excitation temperature used for the figure is shown at the top left. The dashed green line shows the 3σ level. Cases where a line is seen at the 3σ level or above and is used as part of the fitting are marked with a green X at the top right corner of the box.
Current usage metrics show cumulative count of Article Views (full-text article views including HTML views, PDF and ePub downloads, according to the available data) and Abstracts Views on Vision4Press platform.
Data correspond to usage on the plateform after 2015. The current usage metrics is available 48-96 hours after online publication and is updated daily on week days.
Initial download of the metrics may take a while.