Fig. 1
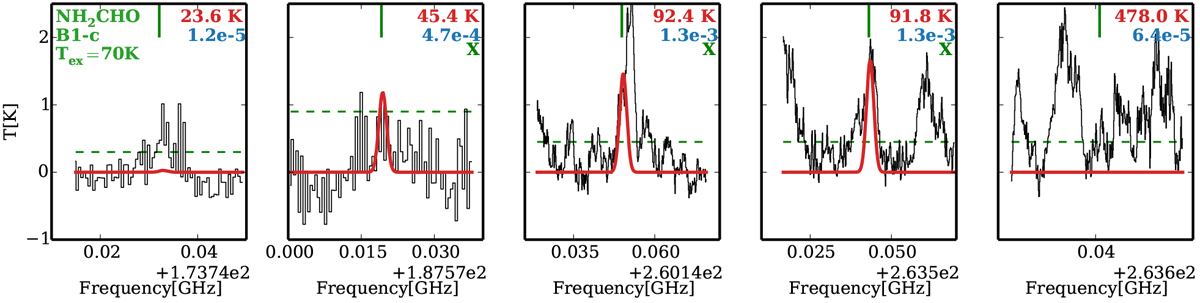
Best fitted model to combined Band 5 and 6 NH2CHO data for B1-c in red and data in black. Each graph shows one line of NH2CHO with its upper state energy level and the Aij coefficient at the top right in red and blue, respectively. The dashed green line indicates the 3σ level. The lines above the 3σ level that were used in the fitting are indicated by a green X. The lines with upper energy levels above 1000 K and/or Aij below 10−5 are not plotted.
Current usage metrics show cumulative count of Article Views (full-text article views including HTML views, PDF and ePub downloads, according to the available data) and Abstracts Views on Vision4Press platform.
Data correspond to usage on the plateform after 2015. The current usage metrics is available 48-96 hours after online publication and is updated daily on week days.
Initial download of the metrics may take a while.