Fig. 1.
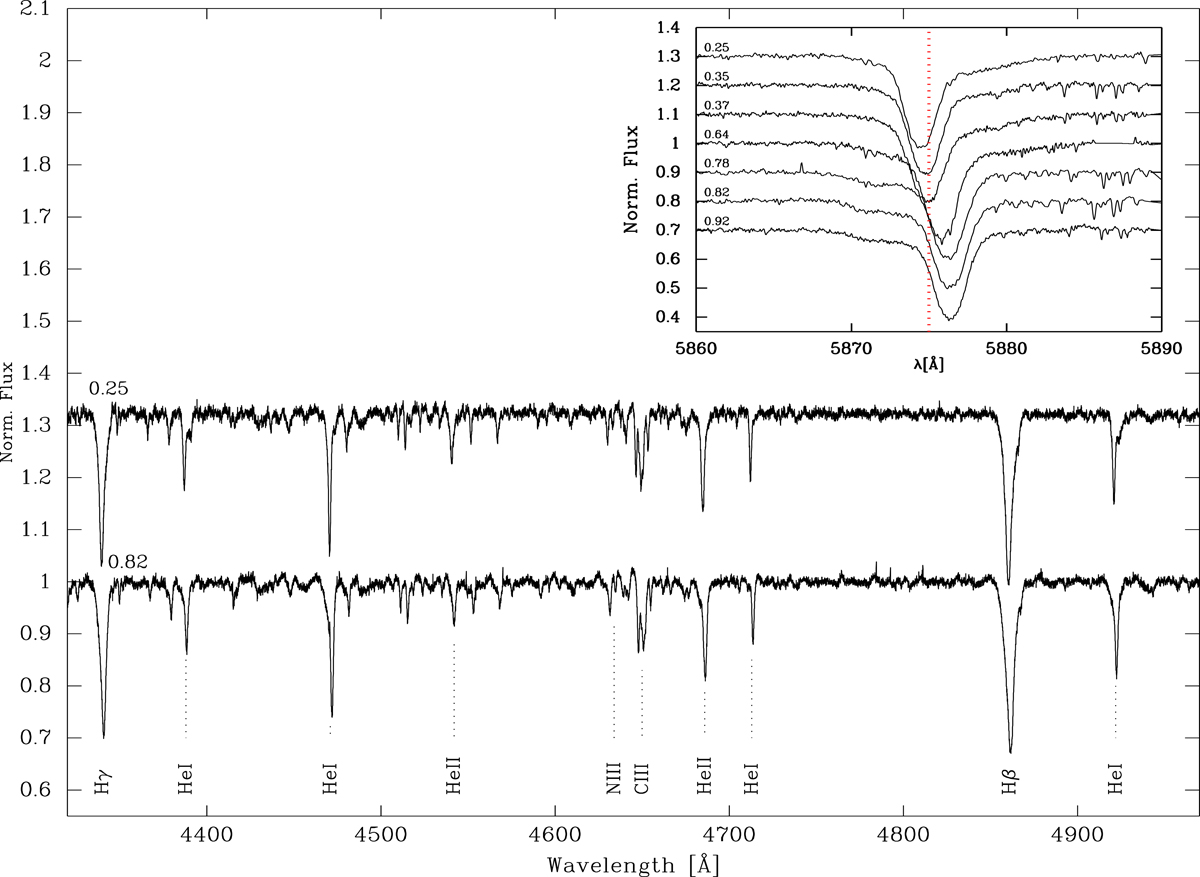
Section of the LCO spectra of HD 96264A obtained near both quadratures. The upper box on the right side of the figure shows LCO and ESO spectra in the region of He Iλ5876 obtained at different orbital phases in order to illustrate the observed variation in the line profile. The phases of the different observations, according to the ephemerides of Table 2, are indicated above the correspondent spectrum.
Current usage metrics show cumulative count of Article Views (full-text article views including HTML views, PDF and ePub downloads, according to the available data) and Abstracts Views on Vision4Press platform.
Data correspond to usage on the plateform after 2015. The current usage metrics is available 48-96 hours after online publication and is updated daily on week days.
Initial download of the metrics may take a while.