Fig. 6
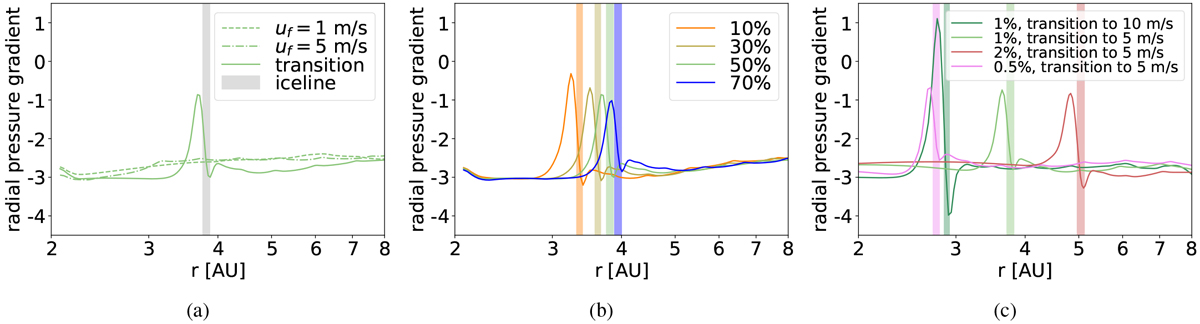
Radial pressure gradient as a function of the orbital distance for discs with a viscosity of α = 5 × 10⁻³. Left panel: radial pressure gradients that originate from the discs displayed in Fig. 3. Middle panel: pressure gradient of discs that feature a transition in the dust fragmentation velocity for different water abundances (Fig. 4a). Right panel: pressure gradient of discs with a transition in the dust fragmentation velocity to 5 m s−1 and different dust-to-gas ratios, as well as a disc featuring a transition in the dust fragmentation velocity from 1 to 10 m s−1 and a dust-to-gas ratio of 1% (Fig. 4b). The coloured bars in Figs. 6b and 6c indicate the position of the ice line and are displayed in the colour of their respective disc parameters.
Current usage metrics show cumulative count of Article Views (full-text article views including HTML views, PDF and ePub downloads, according to the available data) and Abstracts Views on Vision4Press platform.
Data correspond to usage on the plateform after 2015. The current usage metrics is available 48-96 hours after online publication and is updated daily on week days.
Initial download of the metrics may take a while.