Fig. 1
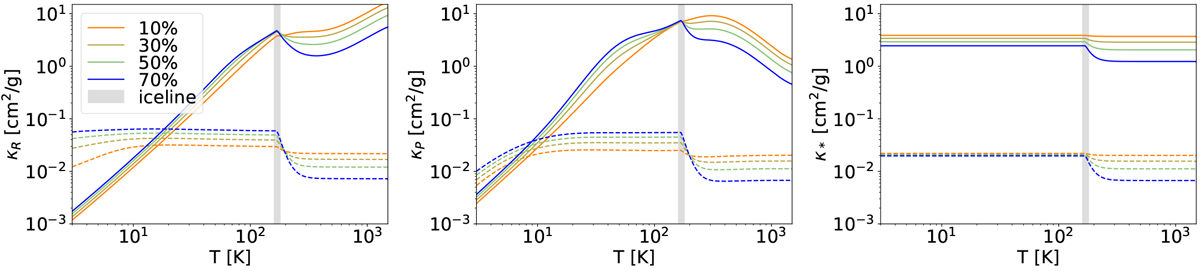
Rosseland, Planck, and stellar mean opacities (from left to right) as a function of temperature for grains with water abundances of 10, 30, 50, and 70%. We calculated these opacities with RADMC-3D for a dust-to-gas ratio of 1%. The solid lines correspond to a grain size of 1 μm, and the dashed lines correspond to a size of 1 mm. The water-ice line transition (vertical grey line) is located at (170 ± 10) K, causing a transition in opacity due to the evaporation and condensation of dust grains.
Current usage metrics show cumulative count of Article Views (full-text article views including HTML views, PDF and ePub downloads, according to the available data) and Abstracts Views on Vision4Press platform.
Data correspond to usage on the plateform after 2015. The current usage metrics is available 48-96 hours after online publication and is updated daily on week days.
Initial download of the metrics may take a while.