Free Access
Fig. 4.
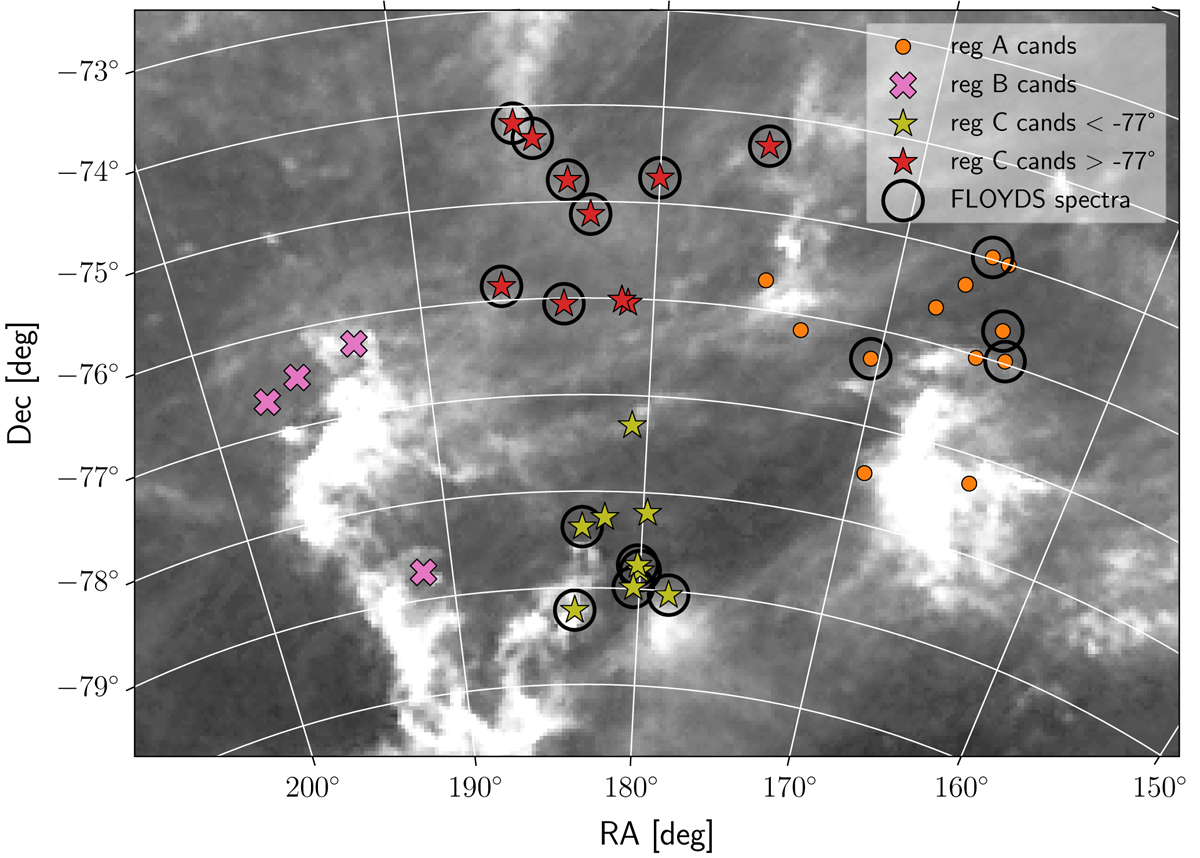
Planck 857 GHz dust map of the Chamaeleon region, showing the candidates identified in this work. The black open circles denote those candidates for which we obtained spectra using FLOYDS spectrograph.
Current usage metrics show cumulative count of Article Views (full-text article views including HTML views, PDF and ePub downloads, according to the available data) and Abstracts Views on Vision4Press platform.
Data correspond to usage on the plateform after 2015. The current usage metrics is available 48-96 hours after online publication and is updated daily on week days.
Initial download of the metrics may take a while.