Fig. 3.
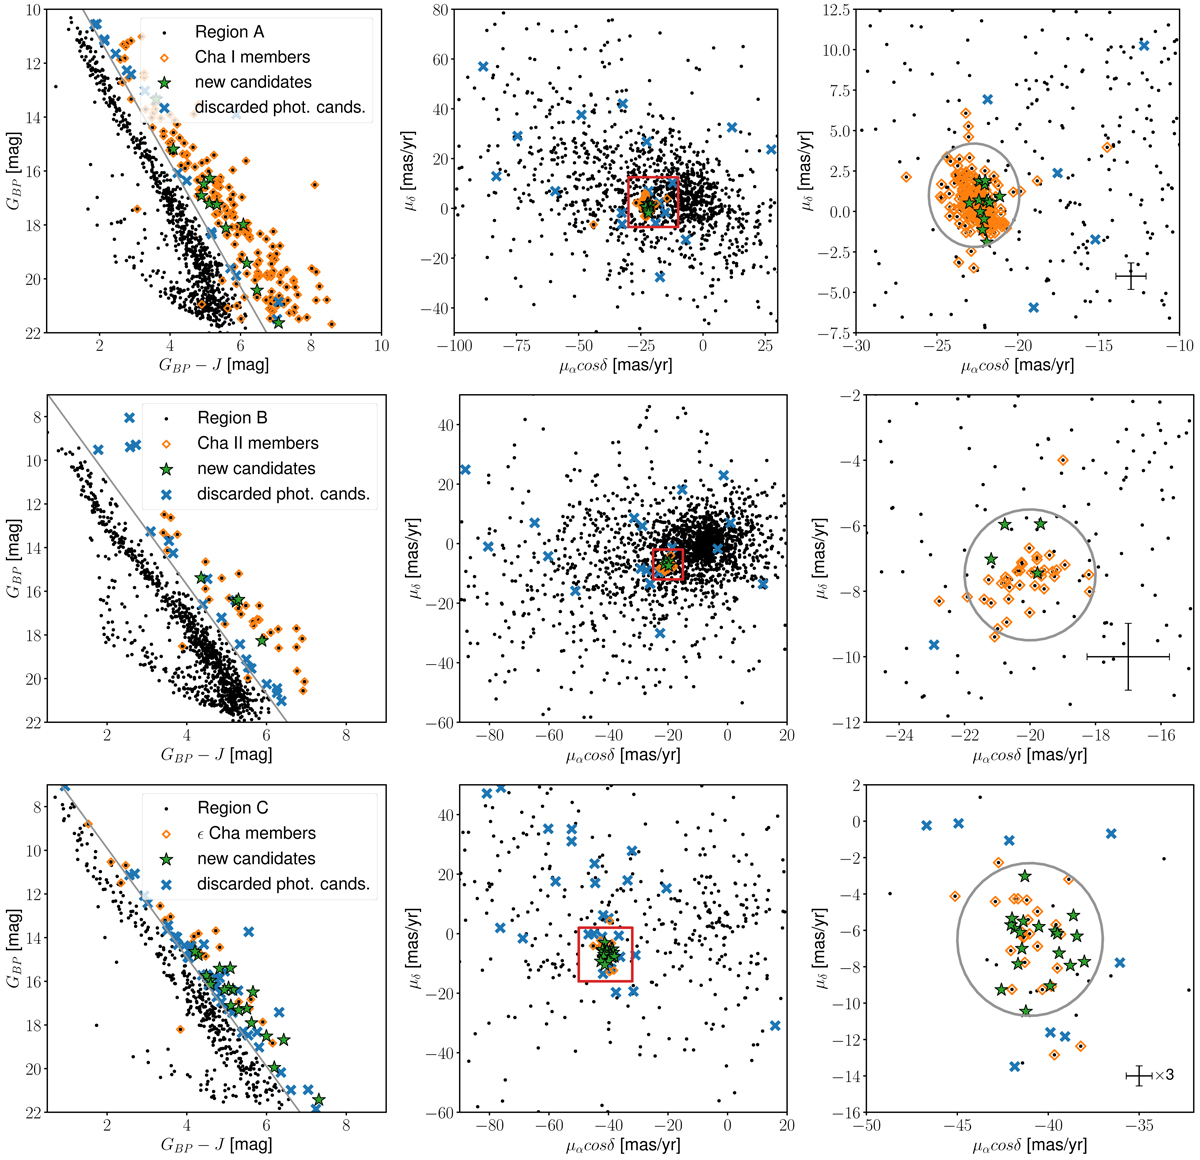
Candidate selection based on colours and proper motions, with each row corresponding to one of the three regions of interest. The panels to the left show the GBP − J, GBP CMDs. The middle panels contain the proper motions; the red rectangle indicates the zoomed-in region of the plot, which is shown in the right-hand side panels. New candidates (green stars) are accepted if their colours and proper motions overlap with those of previously confirmed members (orange diamonds); that is sources are located to the right of the grey line in the panels to the left and inside the grey ellipse shown in the right-hand panels. Precise equations are listed in Appendix A. Photometric members with discrepant proper motions are indicated with blue crosses. The average proper motion uncertainties are shown in the lower right part of the zoomed-in proper motion plots; for region C these values were multiplied by 3 for better visibility.
Current usage metrics show cumulative count of Article Views (full-text article views including HTML views, PDF and ePub downloads, according to the available data) and Abstracts Views on Vision4Press platform.
Data correspond to usage on the plateform after 2015. The current usage metrics is available 48-96 hours after online publication and is updated daily on week days.
Initial download of the metrics may take a while.