Fig. 12.
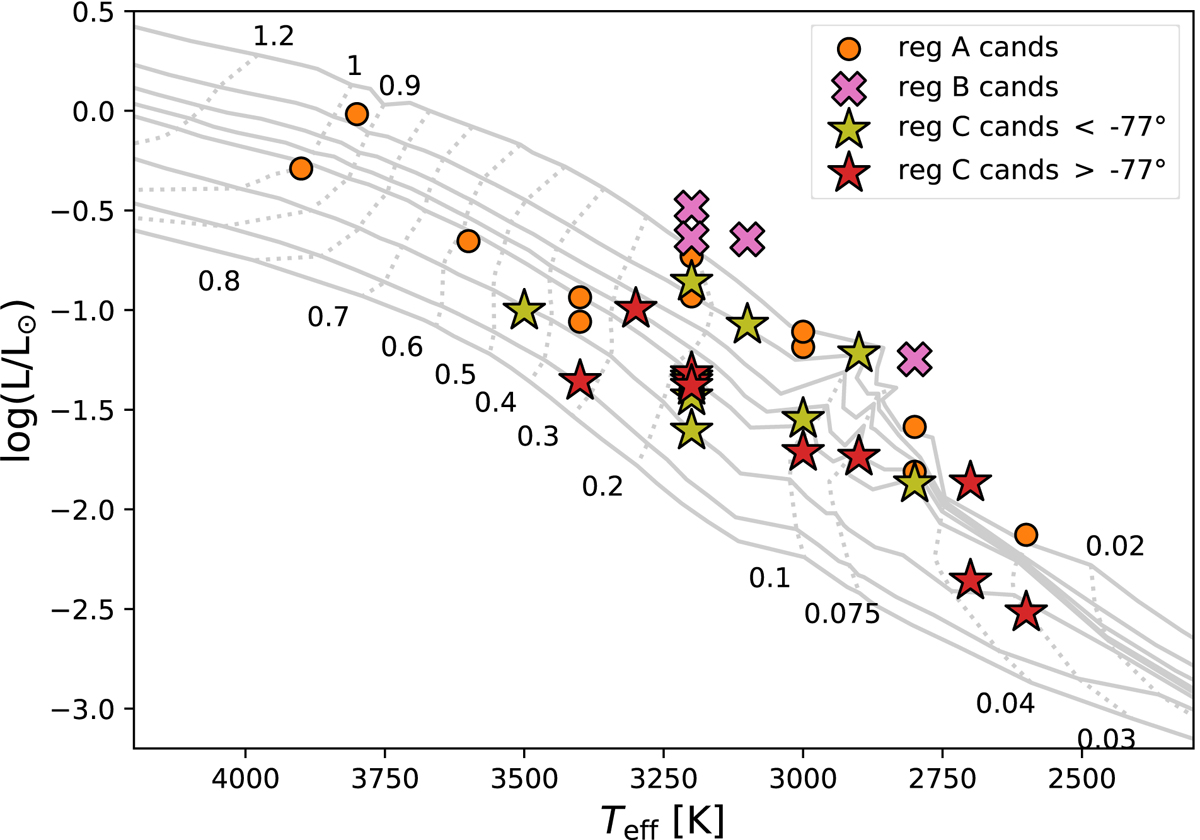
Hertzsprung-Russell diagram for the candidates, along with the BT-Settl isochrones (solid lines) and the lines of constant mass (dotted lines). The isochrones correspond to the ages (1, 2, 3, 4, 5 (darker line), 10, 20, 30) Myr, from top to bottom, and the masses are given in M⊙. The uncertainties in Teff are 100 K, reflecting the spacing of the grid, while those in log L are comparable to or smaller than the symbol sizes.
Current usage metrics show cumulative count of Article Views (full-text article views including HTML views, PDF and ePub downloads, according to the available data) and Abstracts Views on Vision4Press platform.
Data correspond to usage on the plateform after 2015. The current usage metrics is available 48-96 hours after online publication and is updated daily on week days.
Initial download of the metrics may take a while.