Fig. 10.
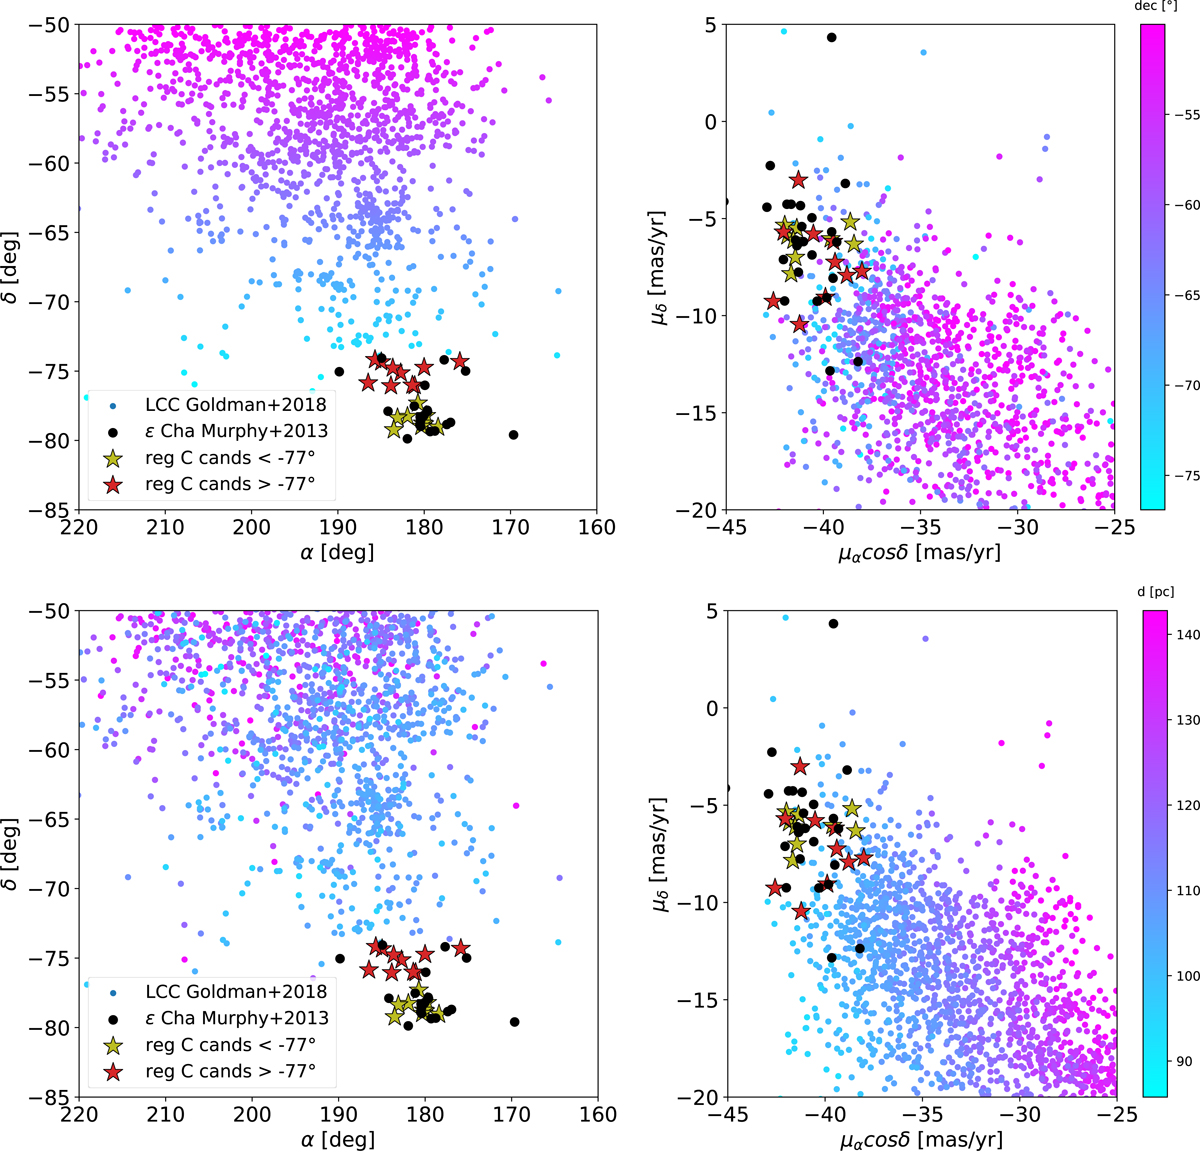
On-sky positions and proper motions of the candidates from region C (red and green stars), along with the members ϵ Cha (black circles Murphy et al. 2013) and Gaia DR2-selected candidate members of LCC (coloured dots Goldman et al. 2018). The LCC sources are coloured according to the declination (top plots) and Gaia DR2 distance (bottom). The distances of ϵ Cha objects in this plot are in the range ∼93–110 pc, similar to our candidates (∼94–113 pc).
Current usage metrics show cumulative count of Article Views (full-text article views including HTML views, PDF and ePub downloads, according to the available data) and Abstracts Views on Vision4Press platform.
Data correspond to usage on the plateform after 2015. The current usage metrics is available 48-96 hours after online publication and is updated daily on week days.
Initial download of the metrics may take a while.