Fig. 9.
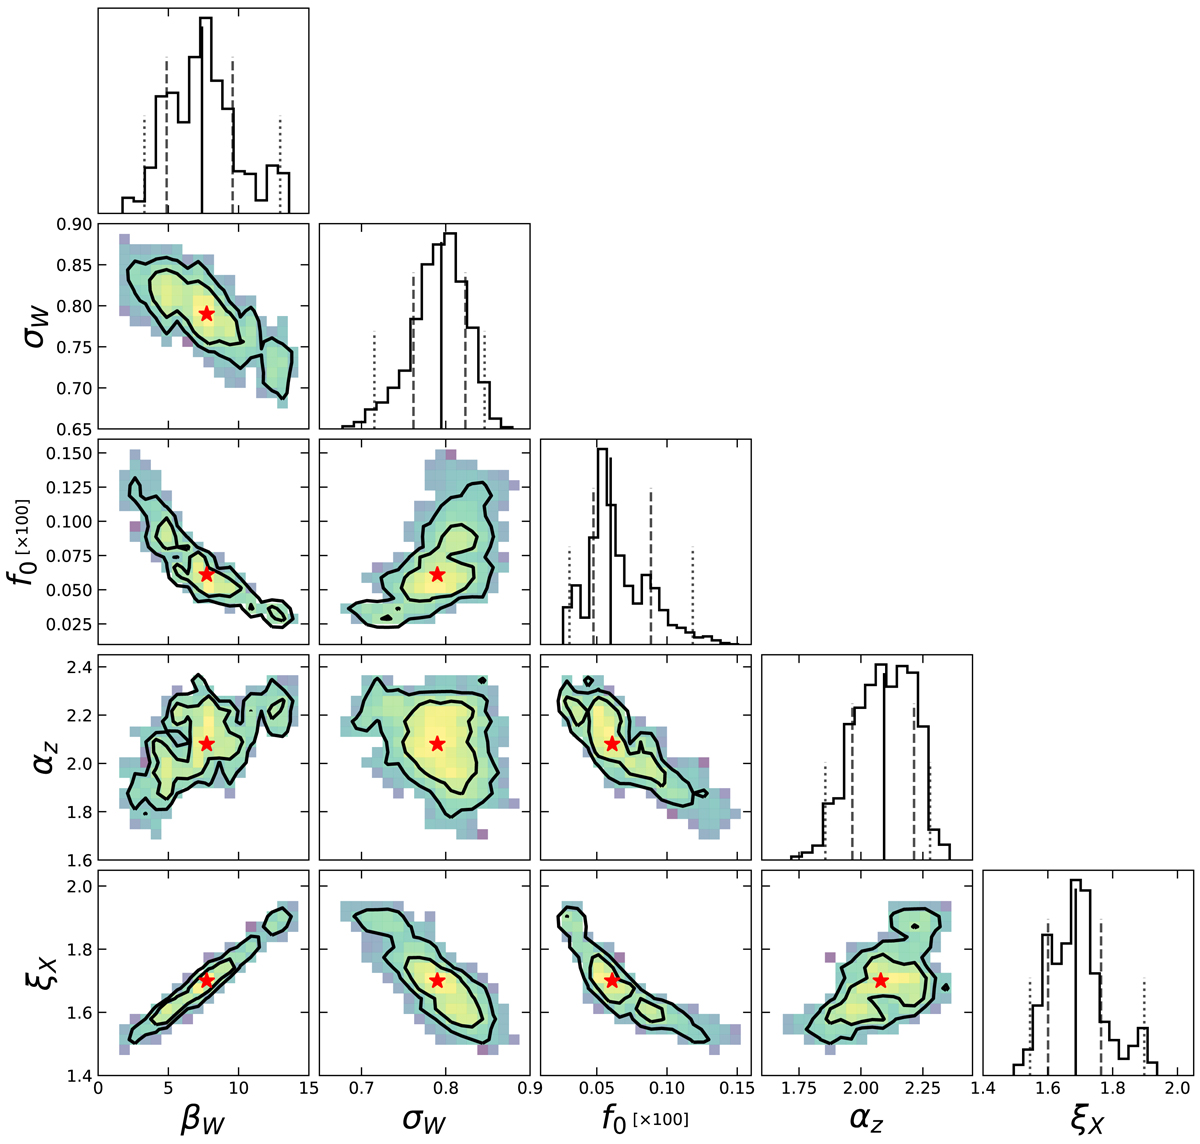
Marginalized PDFs in each 2D sub-space of the model parameters. Contour plots correspond to the 68.3% and 95.4% confidence levels. The model set with the lowest χ2 is indicated by the red stars. The 1D marginalized distributions are also shown, with the median and the 68.3% and 95.4% confidence intervals (solid, dashed, and dotted lines, respectively).
Current usage metrics show cumulative count of Article Views (full-text article views including HTML views, PDF and ePub downloads, according to the available data) and Abstracts Views on Vision4Press platform.
Data correspond to usage on the plateform after 2015. The current usage metrics is available 48-96 hours after online publication and is updated daily on week days.
Initial download of the metrics may take a while.