Fig. 6.
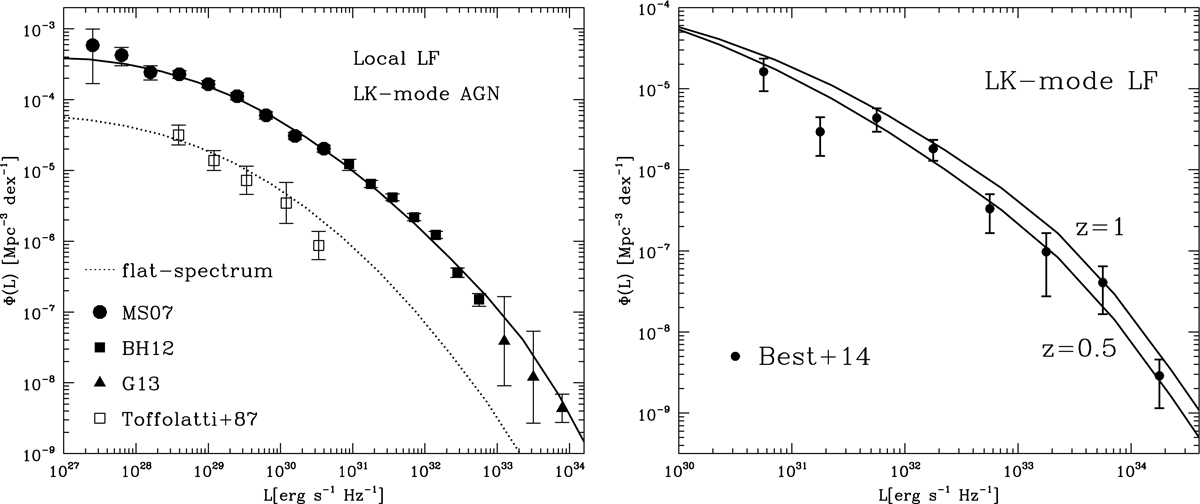
Luminosity function for LK mode AGN. Left panel: model prediction of the local LF for LK mode AGN (solid lines) compared to observational estimates for low-excitation AGN (Mauch & Sadler 2007, solid points; Best & Heckman 2012, solid squares; Gendre et al. 2013, solid triangles). The dotted lines are the predictions for flat-spectrum LK mode AGN, while open squares are the local LF for flat-spectrum radio sources estimated by Toffolatti et al. (1987). Right panel: model predictions of the LK mode LF at z = 0.5 and 1, compared with estimates of the LF of jet-mode AGN at 0.5 < z < 1.0 from Best et al. (2014).
Current usage metrics show cumulative count of Article Views (full-text article views including HTML views, PDF and ePub downloads, according to the available data) and Abstracts Views on Vision4Press platform.
Data correspond to usage on the plateform after 2015. The current usage metrics is available 48-96 hours after online publication and is updated daily on week days.
Initial download of the metrics may take a while.