Fig. 5.
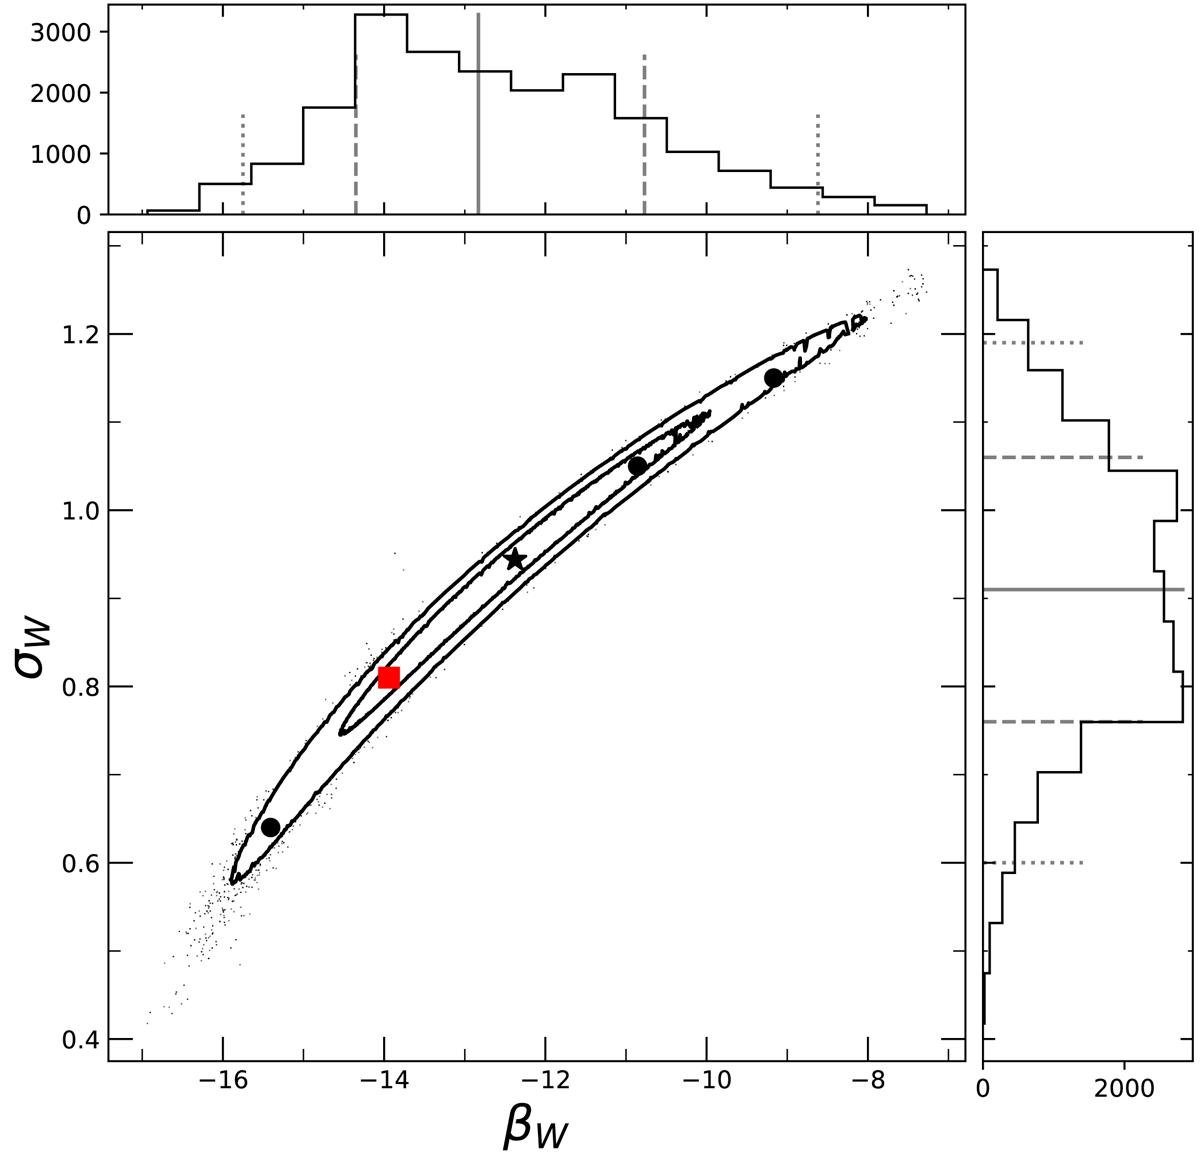
PDF of the model parameters βW and σW. Contour plots correspond to the 68.3% and 95.4% confidence levels. The large solid points are the model sets used in Appendix A to fit total LFs and number counts: the black star corresponds to the case with the minimum χ2 in the LK mode fit and the red square to the case with the minimum χ2 in the global fit. The marginalized distributions are also shown, with the median and the 68.3% and 95.4% confidence intervals (solid, dashed, and dotted lines, respectively).
Current usage metrics show cumulative count of Article Views (full-text article views including HTML views, PDF and ePub downloads, according to the available data) and Abstracts Views on Vision4Press platform.
Data correspond to usage on the plateform after 2015. The current usage metrics is available 48-96 hours after online publication and is updated daily on week days.
Initial download of the metrics may take a while.