Fig. 14.
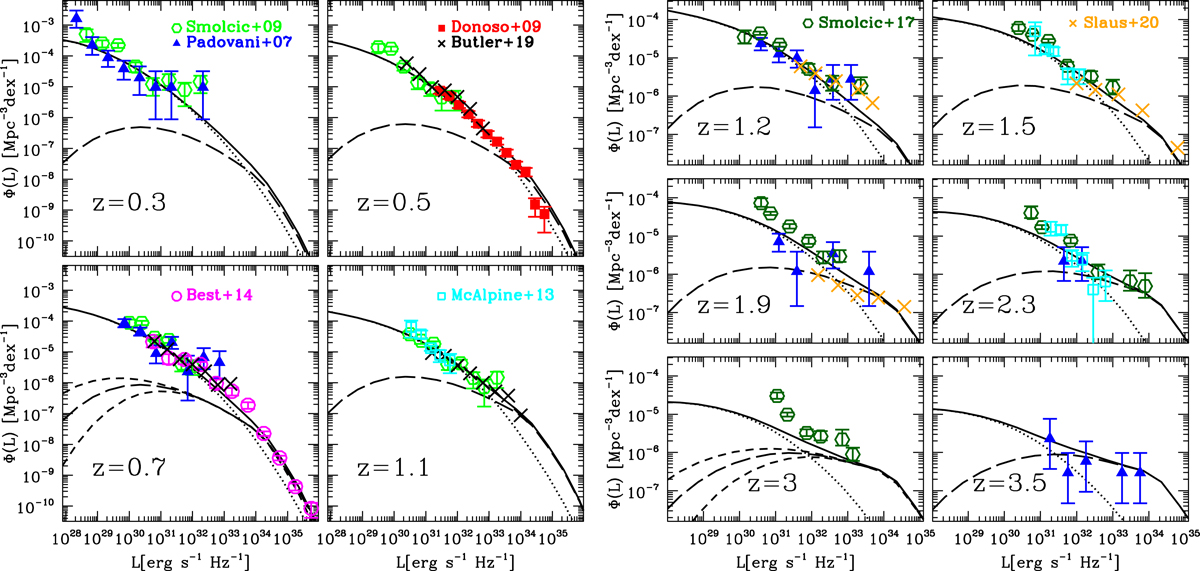
Predictions of the LF for the total (solid lines), LK mode (dotted lines), and HK mode (long and short dashed lines for the best fit and for the lower and upper limits) AGN population at different redshifts. Observational data are from Padovani et al. (2007, blue solid triangles), Smolčić et al. (2009, green open hexagons), Donoso et al. (2009, red solid squares), McAlpine et al. (2013, cyan open squares), Best et al. (2014, magenta open circles), Smolčić et al. (2017a, dark green open hexagon), Butler et al. (2019, black crosses) and Šlaus et al. (2020, orange crosses).
Current usage metrics show cumulative count of Article Views (full-text article views including HTML views, PDF and ePub downloads, according to the available data) and Abstracts Views on Vision4Press platform.
Data correspond to usage on the plateform after 2015. The current usage metrics is available 48-96 hours after online publication and is updated daily on week days.
Initial download of the metrics may take a while.