Fig. 13.
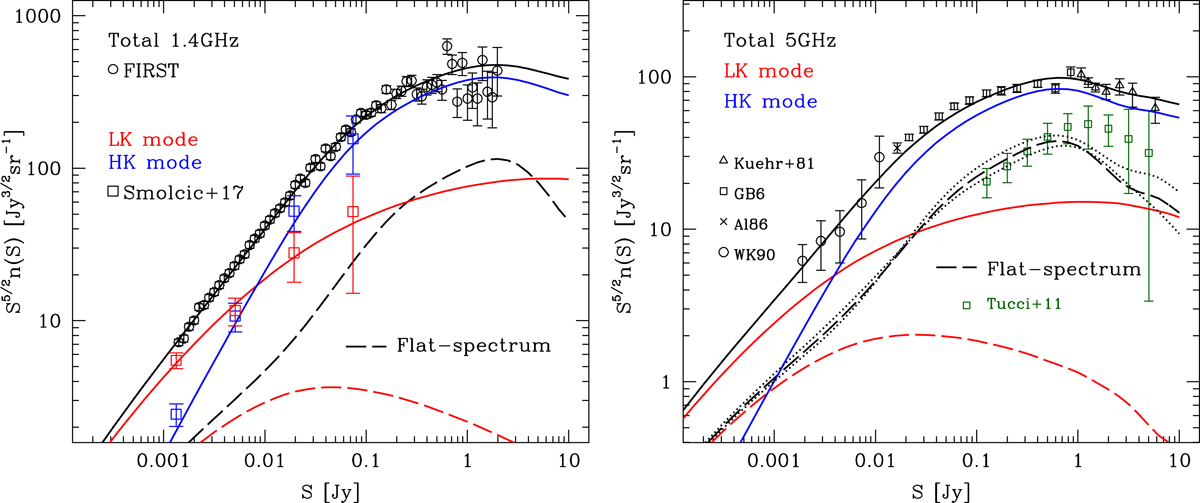
Model predictions of number counts at 1.4 GHz (left panel) and at 5 GHz (right panel) for the total AGN population (black lines), for LK mode (red curves) and HK mode (blue curves) AGN. Number counts of flat-spectrum sources are shown as dashed lines (same colours as for the total population; dotted lines in the right panel are for the model upper and lower limits). At 1.4 GHz black points are from the FIRST survey (White et al. 1997), while red and blue open squares are number counts of LK and HK mode AGN, respectively, estimated by Smolčić et al. (2017b). At 5 GHz the black points are from a compilation of data collected by de Zotti et al. (2010), including the GB6 Catalogue (Gregory et al. 1996), the catalogue of Jy sources from Kuehr et al. (1981) and data from Wrobel & Krause (1990, WK90) and Altschuler (1986, Al86). Blue points are estimates for flat-spectrum sources from Tucci et al. (2011).
Current usage metrics show cumulative count of Article Views (full-text article views including HTML views, PDF and ePub downloads, according to the available data) and Abstracts Views on Vision4Press platform.
Data correspond to usage on the plateform after 2015. The current usage metrics is available 48-96 hours after online publication and is updated daily on week days.
Initial download of the metrics may take a while.