Fig. 11.
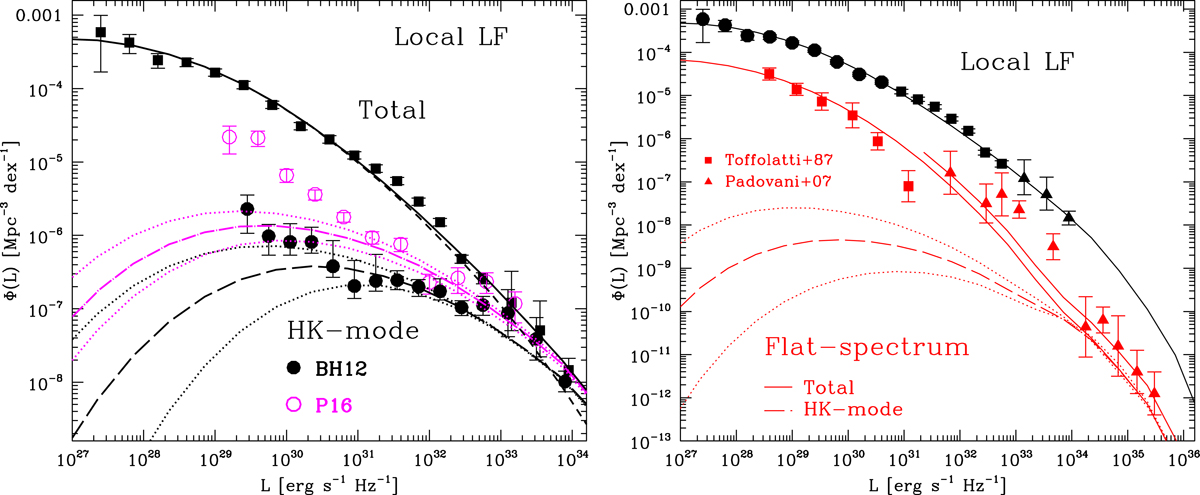
Local luminosity function of radio-loud AGN at 1.4 GHz from observational data (black solid points, as in Fig. 6) and from the best-fit model (black solid lines). Left plot: HK mode LF from Best & Heckman (2012, BH12; solid black points) and from Pracy et al. (2016, P16; open magenta circles) are compared with model predictions for HK mode AGN (long dashed curves for the best-fit model and dotted lines for the upper and lower limits; black lines for the BH12-based model and magenta lines for the P16-based model). The predicted LF for LK mode AGN is also included (dashed black curve). Right plot: local LF of flat-spectrum sources from observations (red squares for Toffolatti et al. 1987; red triangles for Padovani et al. 2007) is compared with model predictions (red lines: solid for the total AGN population at z = 0.1 and 0.3; long dashed and dotted lines for the best-fit model and the upper and lower cases of HK mode AGN at z = 0.1).
Current usage metrics show cumulative count of Article Views (full-text article views including HTML views, PDF and ePub downloads, according to the available data) and Abstracts Views on Vision4Press platform.
Data correspond to usage on the plateform after 2015. The current usage metrics is available 48-96 hours after online publication and is updated daily on week days.
Initial download of the metrics may take a while.