Fig. 9
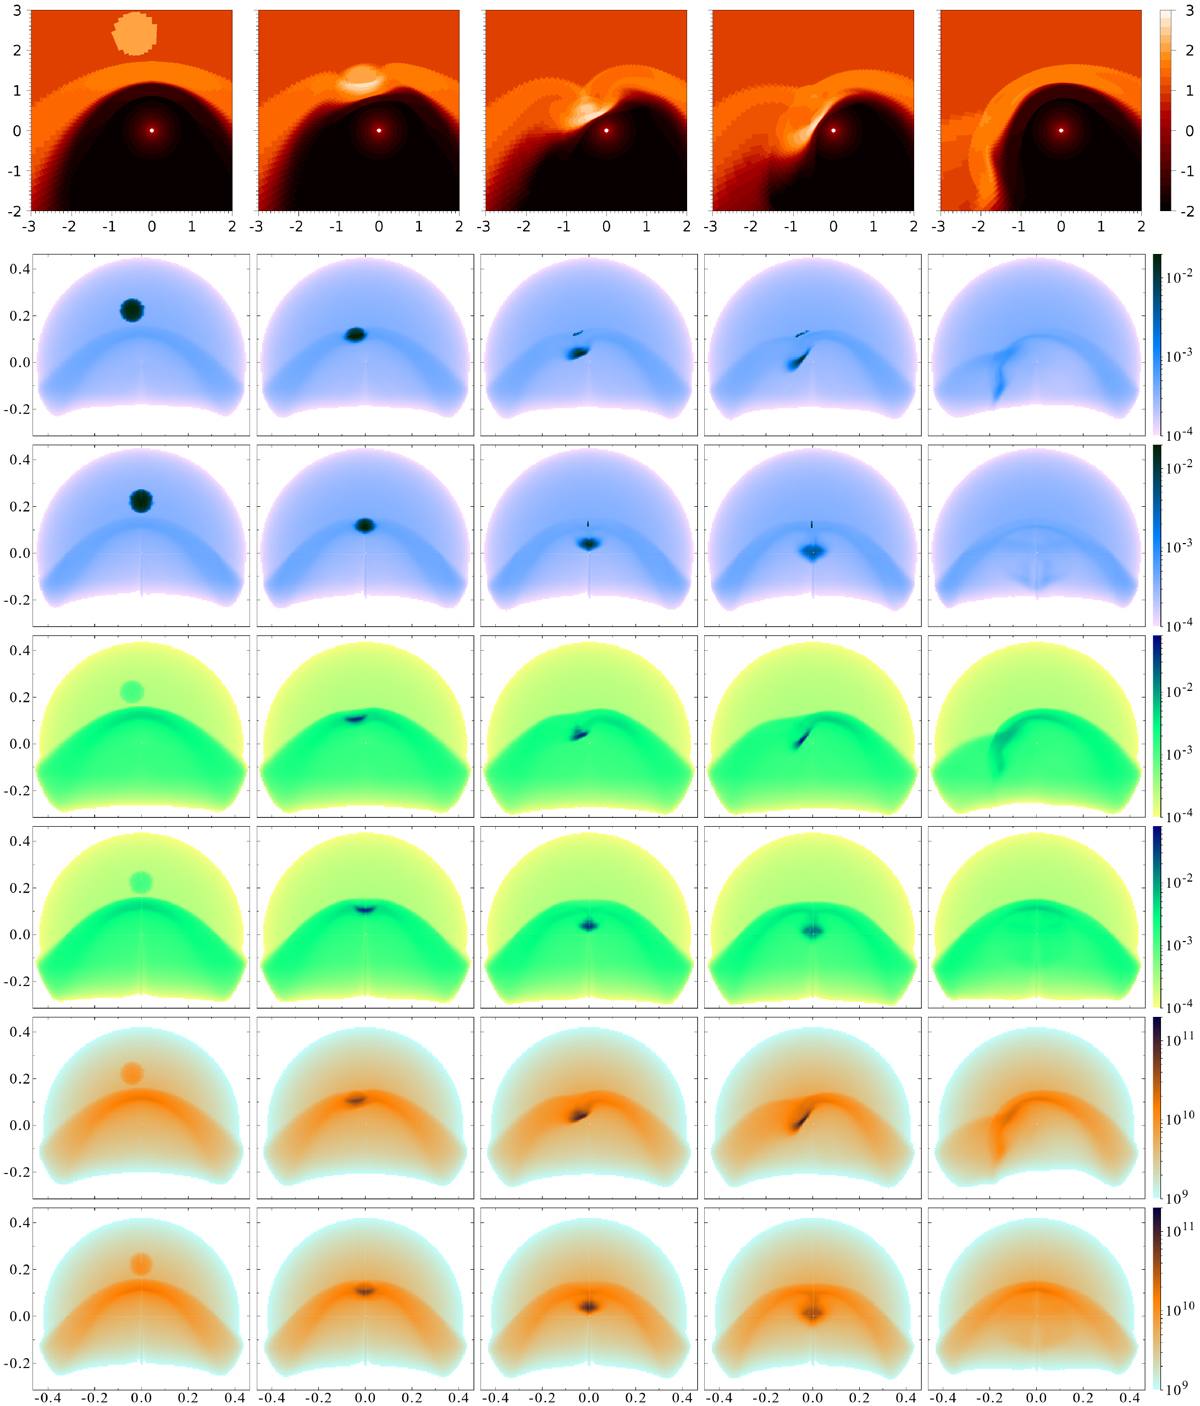
Evolution of the n2blb perturbation. Top row: cross-sections of the log number density log (n [cm−3]) in the n2blb model’s ecliptic plane at Δt ∈{0, 4, 7, 9, 14} × 4.4828 kyr after injecting the perturbation (distances in pc). Six bottom rows: synthetic observations of the above models in Hα (rows 2 and 3) andbremsstrahlung (rows 4 and 5) [erg cm−2 s−1 sr−1] and 70 μm dust emission [Jy sr−1] (rows 6 and 7) at the same times and at a distance of 617 pc, face-on (rows 2, 4, and 6) and edge-on (rows 3, 5, and 7) to the ecliptic (angular extent in degrees). The colour scales have been truncated at the bottom end; values below the minimum threshold are not displayed. The solid angle per pixel is 1.00 × 10⁻⁸ sr.
Current usage metrics show cumulative count of Article Views (full-text article views including HTML views, PDF and ePub downloads, according to the available data) and Abstracts Views on Vision4Press platform.
Data correspond to usage on the plateform after 2015. The current usage metrics is available 48-96 hours after online publication and is updated daily on week days.
Initial download of the metrics may take a while.