Free Access
Fig. 4
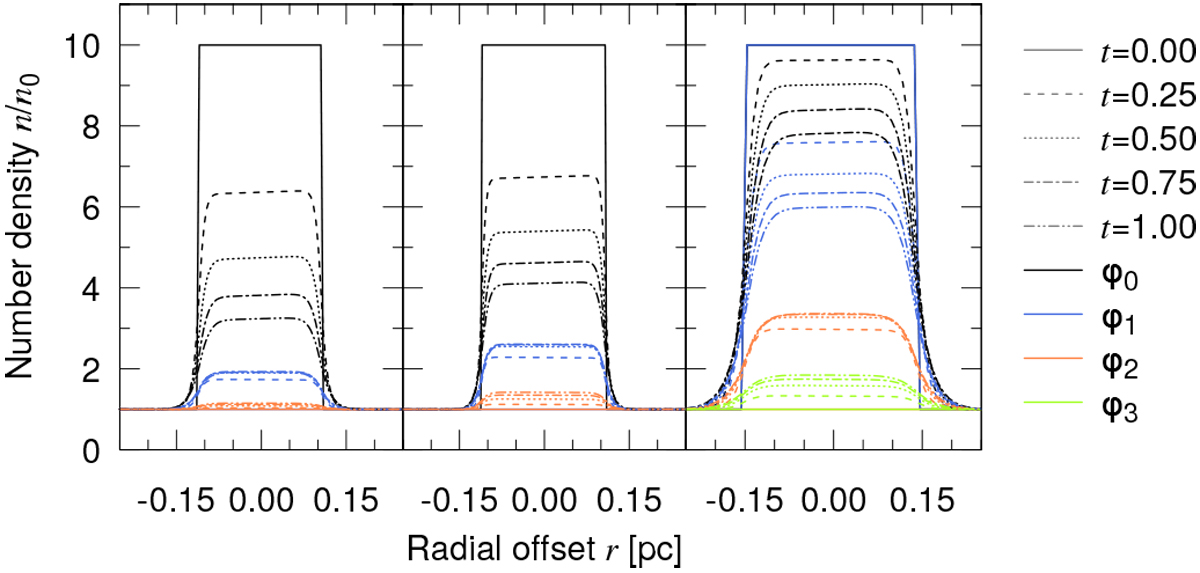
Number density profiles of the diffusion test for the lores (left), hires (centre), and eqres (right) grids; the number density is scaled by the unperturbed ISM value. Dash types denote the time since injection in 44 828 kyr, and line colours denote the offset in the φ-direction, with φi= φ0 + i Δφ.
Current usage metrics show cumulative count of Article Views (full-text article views including HTML views, PDF and ePub downloads, according to the available data) and Abstracts Views on Vision4Press platform.
Data correspond to usage on the plateform after 2015. The current usage metrics is available 48-96 hours after online publication and is updated daily on week days.
Initial download of the metrics may take a while.