Fig. 7
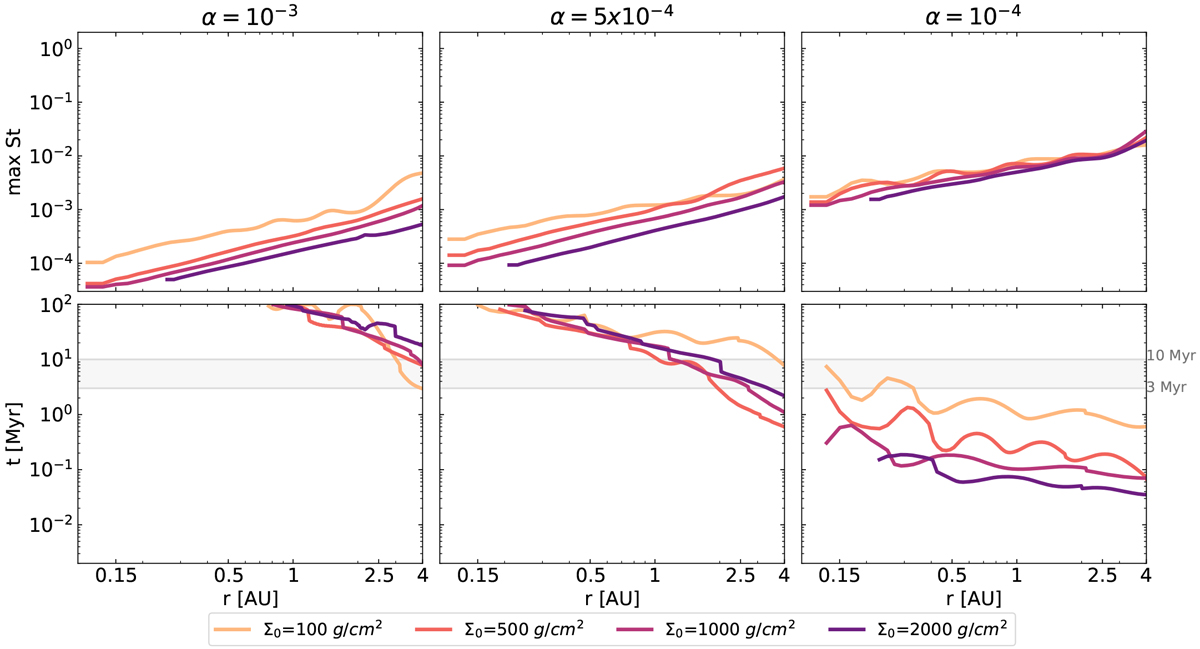
Maximum Stokes number (top plot) and planetary growth timescale until the pebble isolation mass is reached (bottom plot) as a function of orbital distance, for the disks with the four different initial gas surface densities: α = 10−3 (left plot), α = 5 × 10⁻⁴ (middle plot), α = 10−4 (right plot), and uf = 1 m s−1. The gray lines show the typical lifetime range of a protoplanetary disk of 3–10 Myr.
Current usage metrics show cumulative count of Article Views (full-text article views including HTML views, PDF and ePub downloads, according to the available data) and Abstracts Views on Vision4Press platform.
Data correspond to usage on the plateform after 2015. The current usage metrics is available 48-96 hours after online publication and is updated daily on week days.
Initial download of the metrics may take a while.