Fig. 2
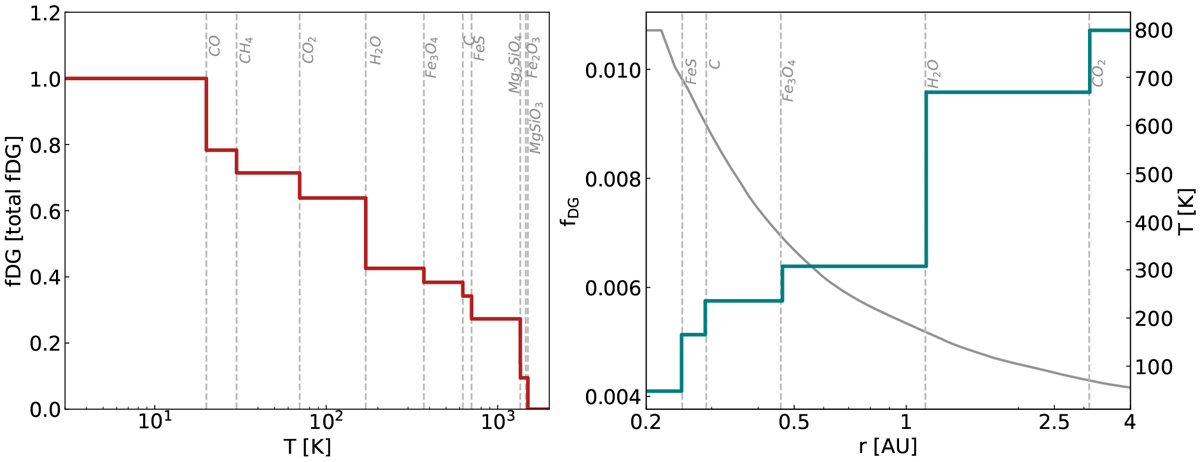
Influence of the evaporation of the different chemical species on the dust-to-gas ratio in the protoplanetary disk. Left plot: dust-to-gas ratio in terms of the total dust-to-gas ratio in the disk as a function of temperature. After each species evaporates the total mass fraction decreases by the corresponding mass fraction (see Table 1) until all species evaporate beyond 1500 K. Right plot: example of the dust-to-gas ratio as a function of orbital distance for the disk with α = 10−3, Σg,0 = 2000 g cm−2, and uf = 10 m s−1, and a globaldust-to-gas ratio of 1.5%. Overplotted is the temperature of the disk where the evaporation fronts are easy to locate.
Current usage metrics show cumulative count of Article Views (full-text article views including HTML views, PDF and ePub downloads, according to the available data) and Abstracts Views on Vision4Press platform.
Data correspond to usage on the plateform after 2015. The current usage metrics is available 48-96 hours after online publication and is updated daily on week days.
Initial download of the metrics may take a while.