Fig. 1
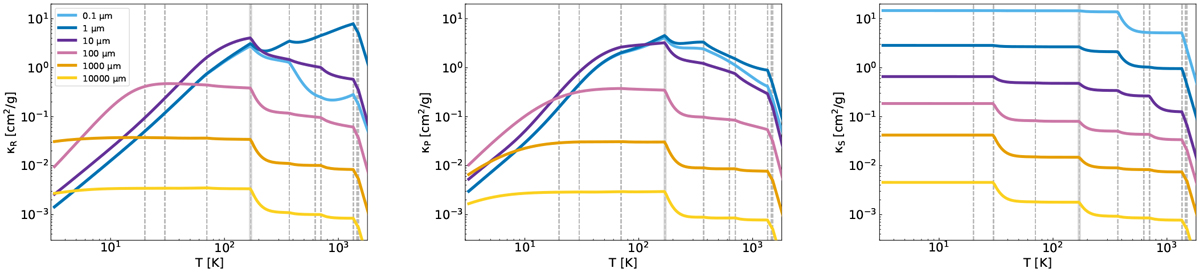
Rosseland, Planck, and stellar mean opacities (from left to right) as a function of temperature for grain sizes of 0.1 μm, 1 μm, 10 μm, 100 μm, 1 mm, and 1 cm. The composition of the grain mixture is presented in Table 1. The gray dashed lines show the evaporation temperatures of the different species, which are (from lowest to the highest) CO, CH4, CO2, H2O, Fe3O4, C, FeS, Mg2SiO4, Fe2O3, and MgSiO3. The water ice evaporation front is shown as a gray band.
Current usage metrics show cumulative count of Article Views (full-text article views including HTML views, PDF and ePub downloads, according to the available data) and Abstracts Views on Vision4Press platform.
Data correspond to usage on the plateform after 2015. The current usage metrics is available 48-96 hours after online publication and is updated daily on week days.
Initial download of the metrics may take a while.