Fig. 9.
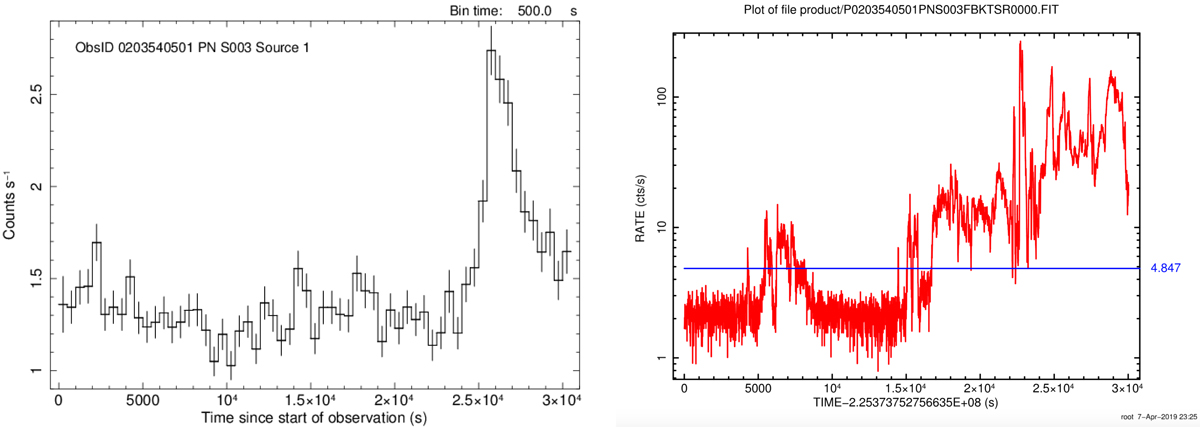
Left panel: EXTraS/STV light curve of the star HD 283810 with uniform time binning (500 s). A large flare is seen in the second half of the observation. The tail probability of a fit with a constant model is < 10−25. The flare is missed by the 4XMM variability analysis because it occurred outside of the GTI (see right panel). Right panel: background light curve of the same observation, taken from the 4XMM products. All observing times with a background rate exceeding the threshold marked by the blue line are rejected. The time interval of the flare (see left panel) is therefore excluded.
Current usage metrics show cumulative count of Article Views (full-text article views including HTML views, PDF and ePub downloads, according to the available data) and Abstracts Views on Vision4Press platform.
Data correspond to usage on the plateform after 2015. The current usage metrics is available 48-96 hours after online publication and is updated daily on week days.
Initial download of the metrics may take a while.