Fig. 5.
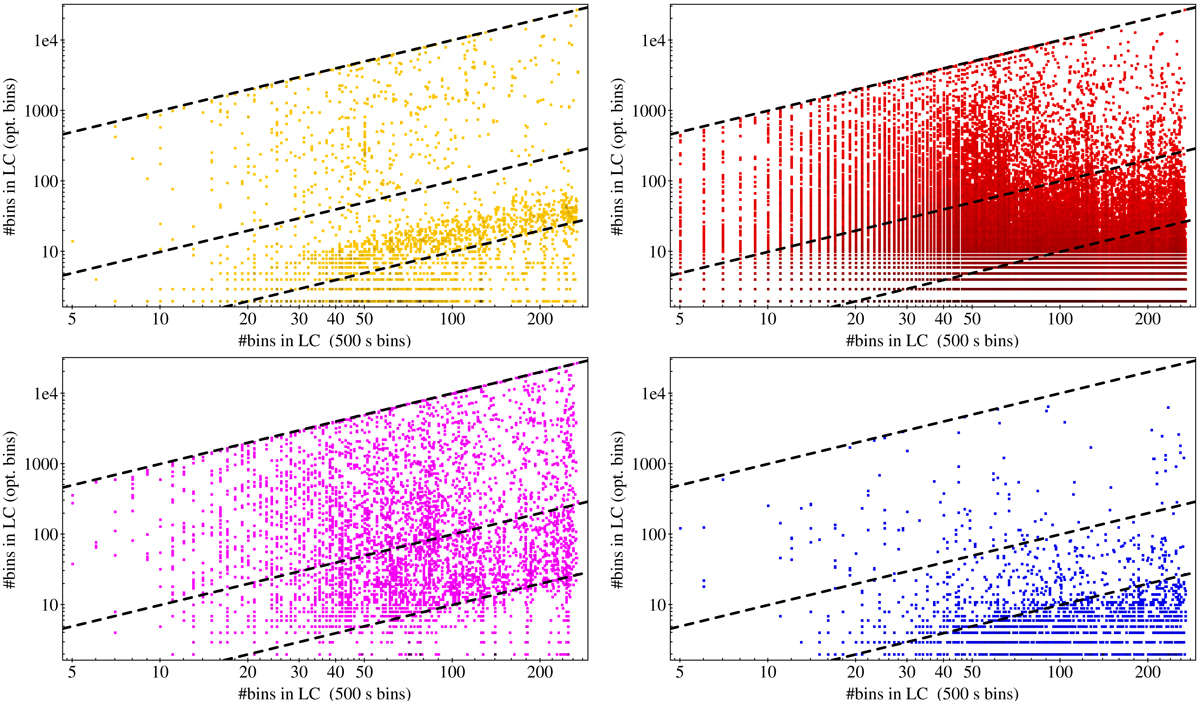
Comparison of the number of bins in 500 s bin light curves and in optimal bin size light curves, colour-coded as in Fig. 4. In each panel, the top dashed line indicates the minimum allowed time bin of 5 s; the middle dashed line indicates sources for which the optimal bin size is exactly 500 s, and the bottom dashed line does the same for 5 ks. The number of bins for the 500 s bin light curve is an indication of the observation length, while lines parallel to the three lines already drawn indicate sources with a similar rate.
Current usage metrics show cumulative count of Article Views (full-text article views including HTML views, PDF and ePub downloads, according to the available data) and Abstracts Views on Vision4Press platform.
Data correspond to usage on the plateform after 2015. The current usage metrics is available 48-96 hours after online publication and is updated daily on week days.
Initial download of the metrics may take a while.