Free Access
Fig. 31.
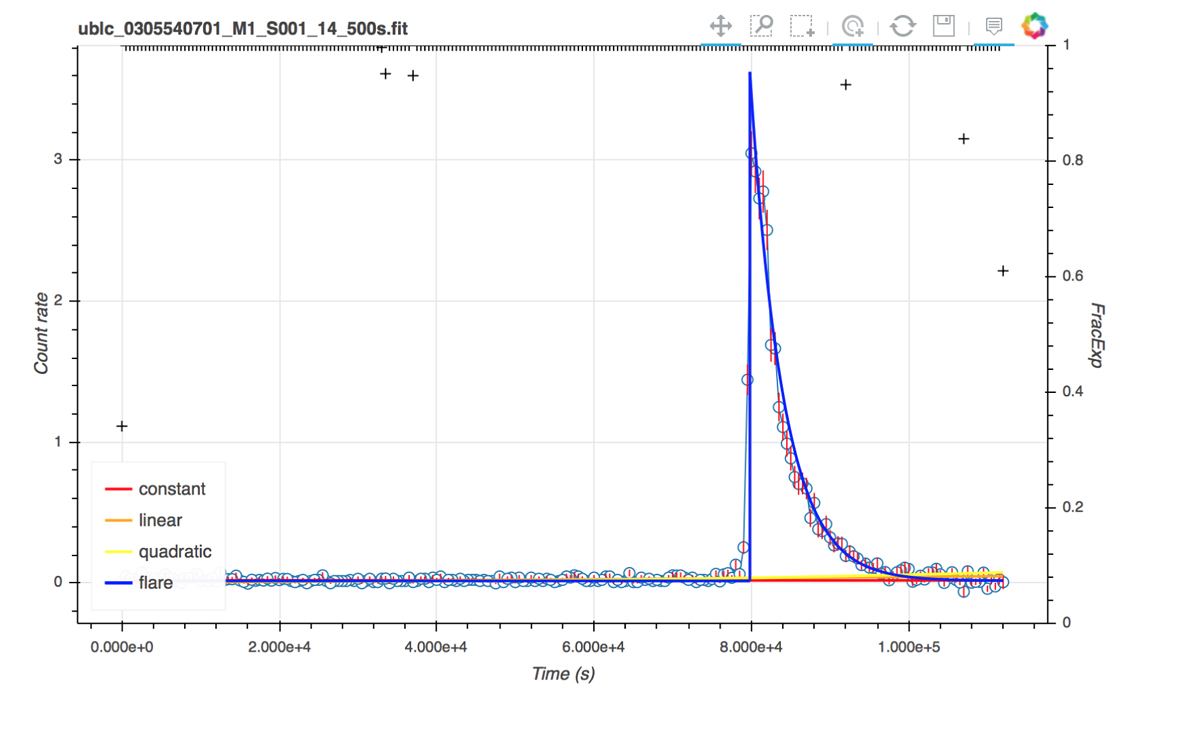
Interactive visualisation of products from the short-term aperiodic variability analysis. The case of a light curve with uniform time binning is shown. By using command buttons on top of the window, the user can e.g., zoom or pan, read count rate and errors by clicking on data points, and overplot best-fit models.
Current usage metrics show cumulative count of Article Views (full-text article views including HTML views, PDF and ePub downloads, according to the available data) and Abstracts Views on Vision4Press platform.
Data correspond to usage on the plateform after 2015. The current usage metrics is available 48-96 hours after online publication and is updated daily on week days.
Initial download of the metrics may take a while.