Fig. 27.
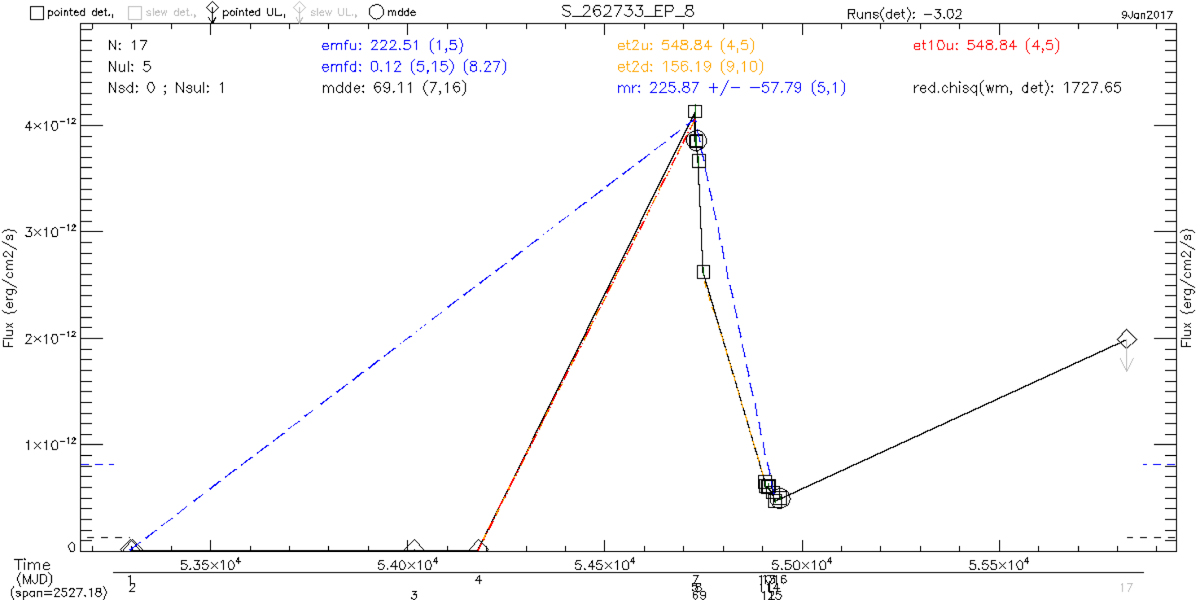
Example long-term light curve of a source (SRCID = 262733) in the LTV catalogue. The main measures and points involved are indicated in the plots by connecting lines, e.g., dashed blue lines join points used in the MR and EMFU/EMFD quantities, while dashed orange and red lines signify changes by a factor 2 and factor 10 in flux between pairs of points. Some of the key LTV measurement values are printed in the graphic for convenience. In some cases, high slew upper limits are not displayed where they suppress the visibility of low-level changes in other data.
Current usage metrics show cumulative count of Article Views (full-text article views including HTML views, PDF and ePub downloads, according to the available data) and Abstracts Views on Vision4Press platform.
Data correspond to usage on the plateform after 2015. The current usage metrics is available 48-96 hours after online publication and is updated daily on week days.
Initial download of the metrics may take a while.