Free Access
Fig. 26.
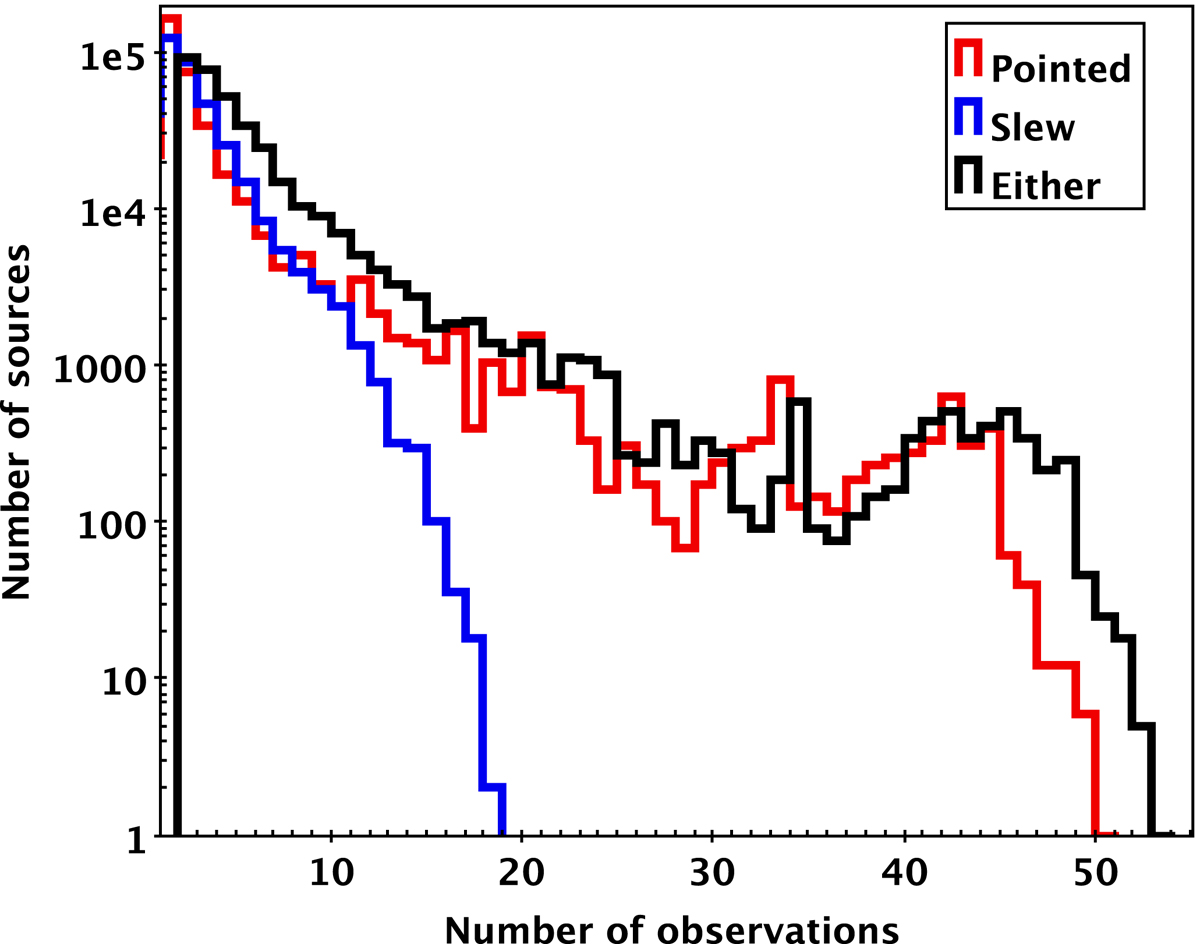
Numbers of sources in the LTV catalogue comprising a given number of observations for pointed data only (red), slew data only (blue), and both (black). The latter histogram starts at 2 because sources comprising only one data point in total are not counted.
Current usage metrics show cumulative count of Article Views (full-text article views including HTML views, PDF and ePub downloads, according to the available data) and Abstracts Views on Vision4Press platform.
Data correspond to usage on the plateform after 2015. The current usage metrics is available 48-96 hours after online publication and is updated daily on week days.
Initial download of the metrics may take a while.