Fig. 25.
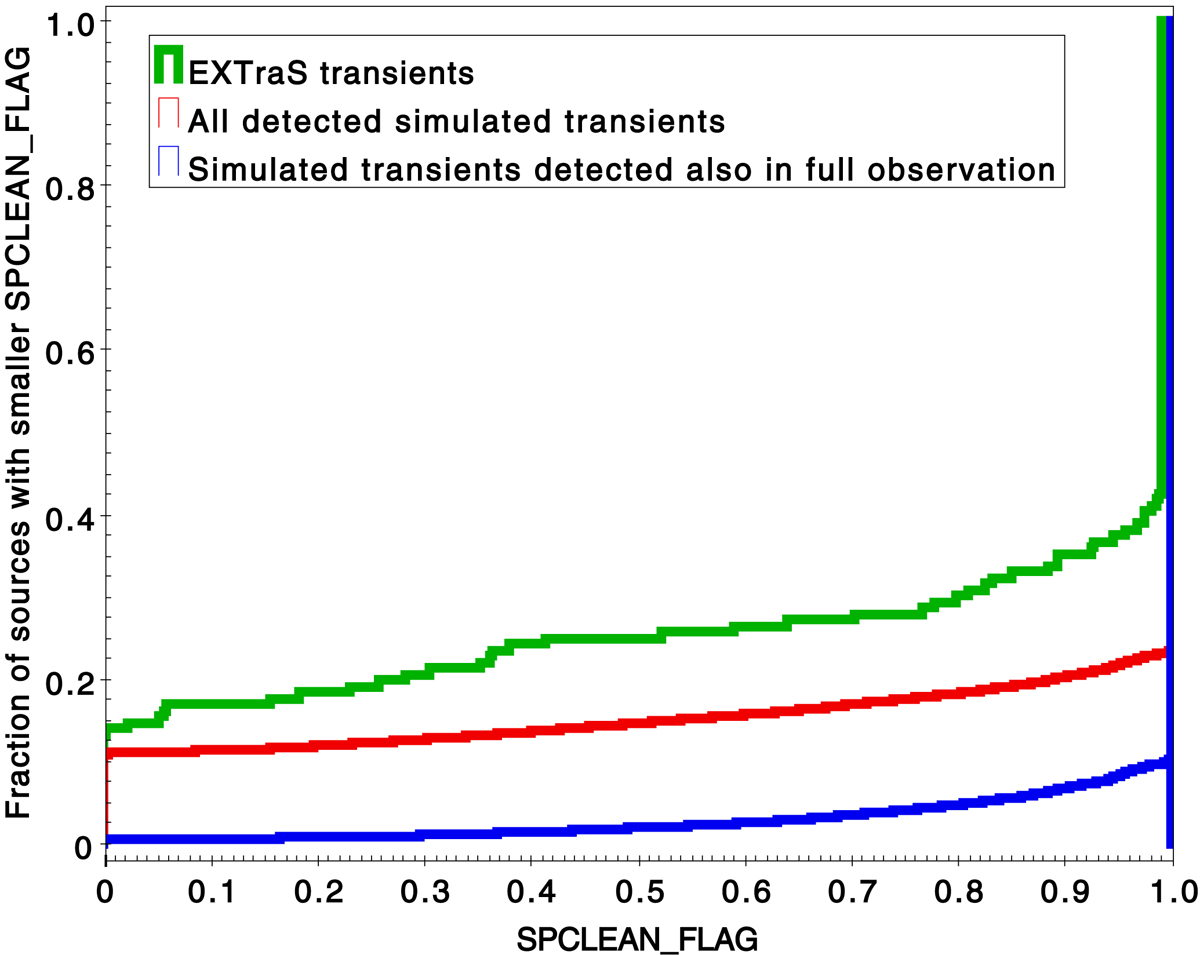
Cumulative distribution of the SPCLEAN_FLAG parameter, indicating the fraction of the BIN0 interval that is not affected by soft protons flares for the EXTraS transients (green), all the simulated transients detected by the EXTraS pipeline (red), and those that were also detected by the 3XMM-DR5 pipeline applied to full observations (blue).
Current usage metrics show cumulative count of Article Views (full-text article views including HTML views, PDF and ePub downloads, according to the available data) and Abstracts Views on Vision4Press platform.
Data correspond to usage on the plateform after 2015. The current usage metrics is available 48-96 hours after online publication and is updated daily on week days.
Initial download of the metrics may take a while.