Free Access
Fig. 22.
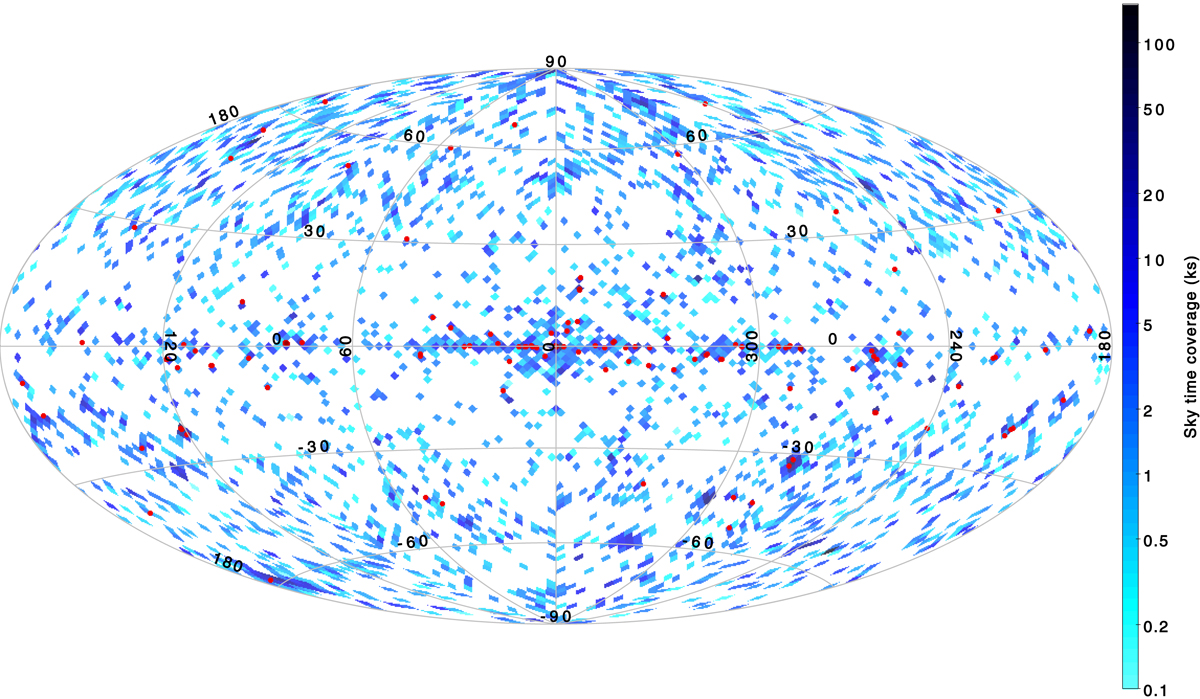
Sky distribution of transients (red circles) over the map of pn sky coverage (∼3.5 square degree regions with the total exposure indicated by the colour bar) is clearly visible.
Current usage metrics show cumulative count of Article Views (full-text article views including HTML views, PDF and ePub downloads, according to the available data) and Abstracts Views on Vision4Press platform.
Data correspond to usage on the plateform after 2015. The current usage metrics is available 48-96 hours after online publication and is updated daily on week days.
Initial download of the metrics may take a while.