Fig. 20.
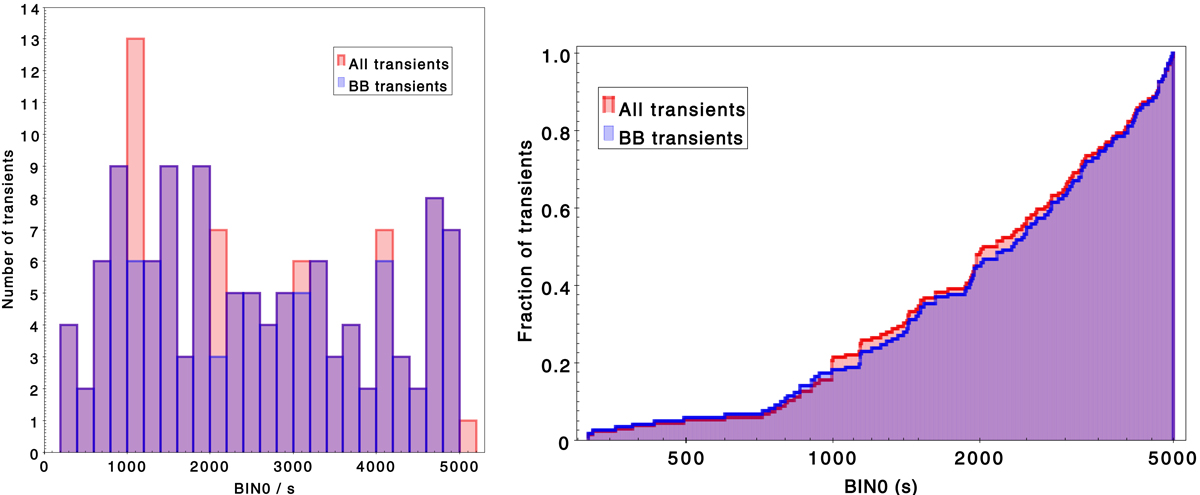
Differential (left panel) and cumulative (right panel) distribution of transient durations (in seconds), defined as the length of the time interval where the source was most significantly detected. The subset of transients discovered using the Bayesian block algorithm is indicated (blue) to exclude the sources discovered with the close-to-source algorithm, whose durations can only be integer multiples of 1000 s.
Current usage metrics show cumulative count of Article Views (full-text article views including HTML views, PDF and ePub downloads, according to the available data) and Abstracts Views on Vision4Press platform.
Data correspond to usage on the plateform after 2015. The current usage metrics is available 48-96 hours after online publication and is updated daily on week days.
Initial download of the metrics may take a while.