Fig. 2.
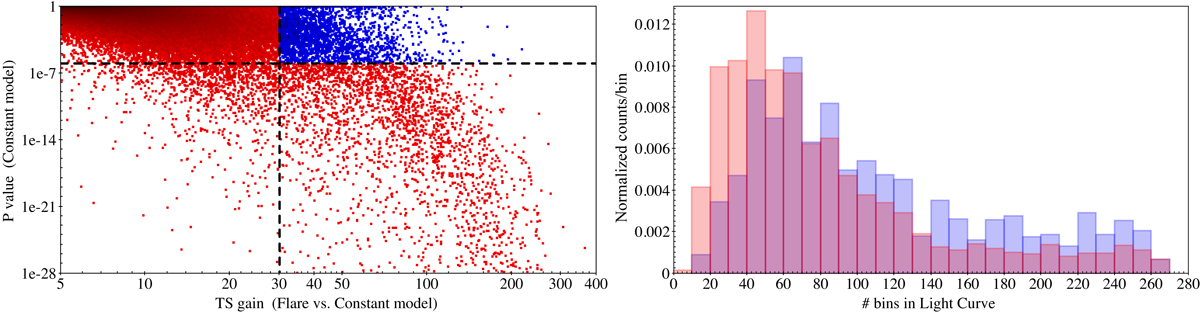
Left panel: gain in TS by adding a flare to a constant vs. the p-value associated with a constant model for 500 s bin light curves. The two lines indicate a threshold of p-value = 10−6 in both axes: the blue points are light curves that are overall compatible with a constant model, but for which a flare improves the fit significantly. Right panel: histogram of the number of bins for the light curves, colour-coded as in the left panel (area of histograms normalised to unity; all bar items start from the baseline).
Current usage metrics show cumulative count of Article Views (full-text article views including HTML views, PDF and ePub downloads, according to the available data) and Abstracts Views on Vision4Press platform.
Data correspond to usage on the plateform after 2015. The current usage metrics is available 48-96 hours after online publication and is updated daily on week days.
Initial download of the metrics may take a while.