Fig. 17.
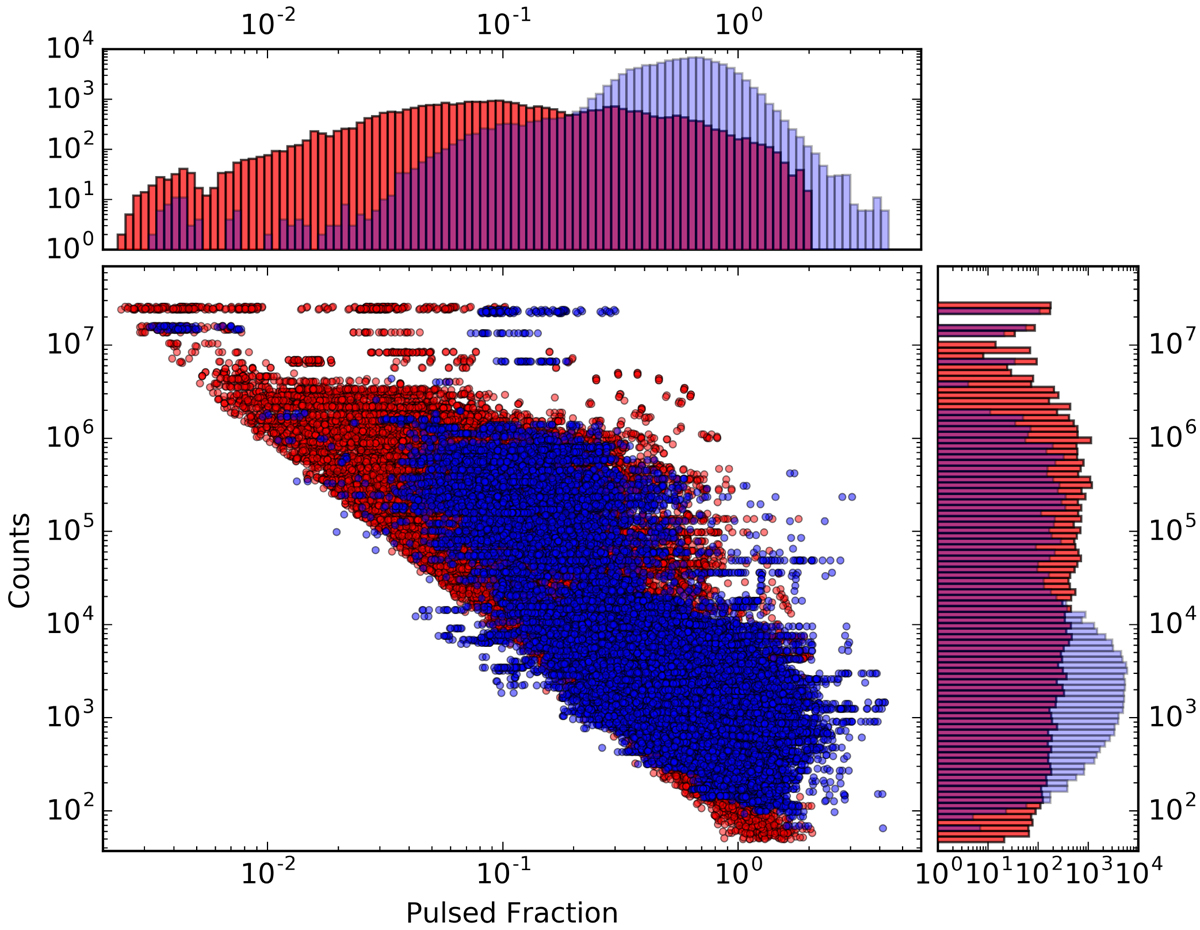
Distribution of all detected period pulsed fractions (defined as the semi-amplitude of the sinusoid divided by the source average count rate) vs. source counts. The blue dots correspond to observations that are affected by counting-mode switches. The red dots correspond to periods detected in observations that are not (or almost not) affected by the counting-mode switch. Histograms of the PFs and counts are presented at the top and left, respectively, for the two datasets.
Current usage metrics show cumulative count of Article Views (full-text article views including HTML views, PDF and ePub downloads, according to the available data) and Abstracts Views on Vision4Press platform.
Data correspond to usage on the plateform after 2015. The current usage metrics is available 48-96 hours after online publication and is updated daily on week days.
Initial download of the metrics may take a while.