Fig. 10.
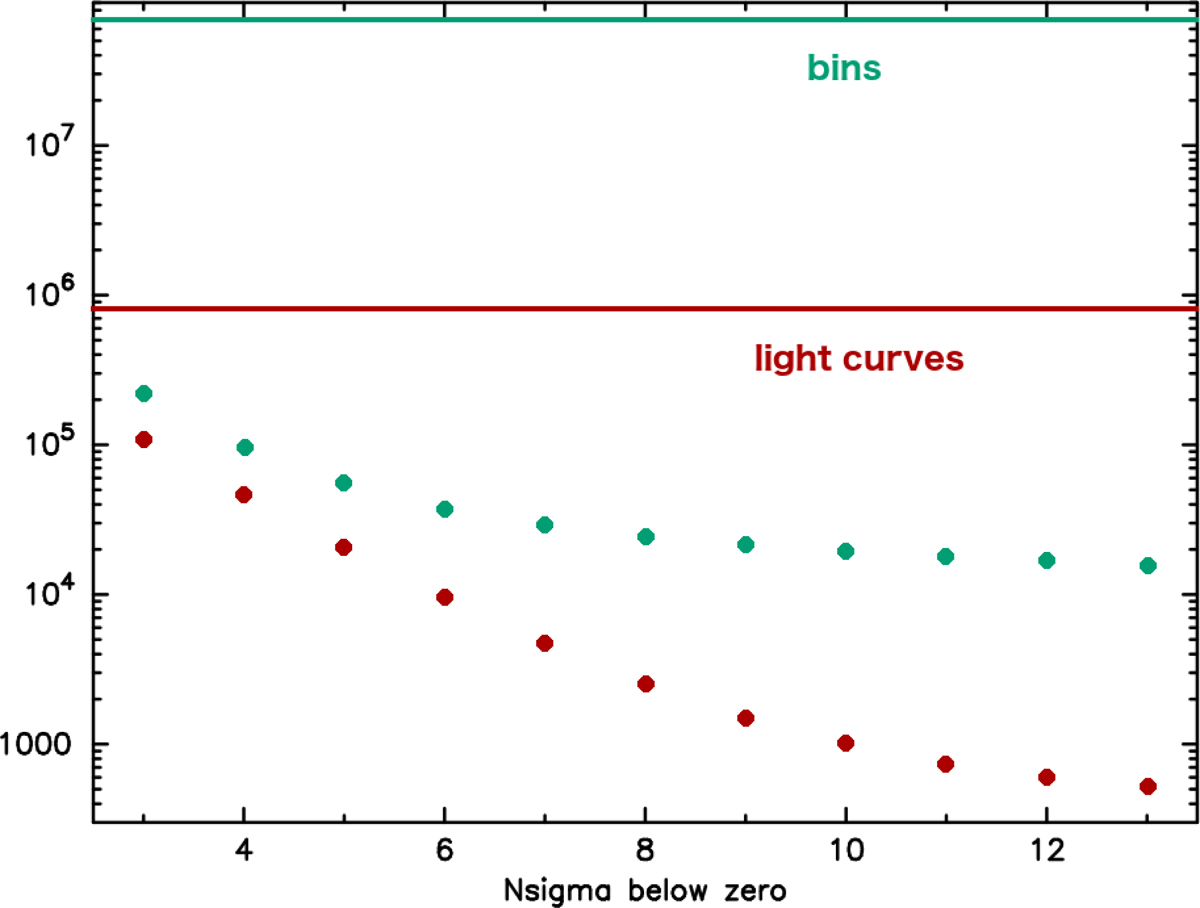
Number of light curves with at least one negative bin by more than Nσ and the overall number of bins below this threshold. The horizontal green line indicates the overall number of bins (8 × 10⁷) in 500 s bin light curves, and the green dots show their number at least Nσ below 0. Similarly, we show the light curves that contain these points in brown. The vertical separation between green and brown dots indicates the average number of negative bins per light curve. The number of bins per light curve increases as the threshold decreases.
Current usage metrics show cumulative count of Article Views (full-text article views including HTML views, PDF and ePub downloads, according to the available data) and Abstracts Views on Vision4Press platform.
Data correspond to usage on the plateform after 2015. The current usage metrics is available 48-96 hours after online publication and is updated daily on week days.
Initial download of the metrics may take a while.