Fig. 1.
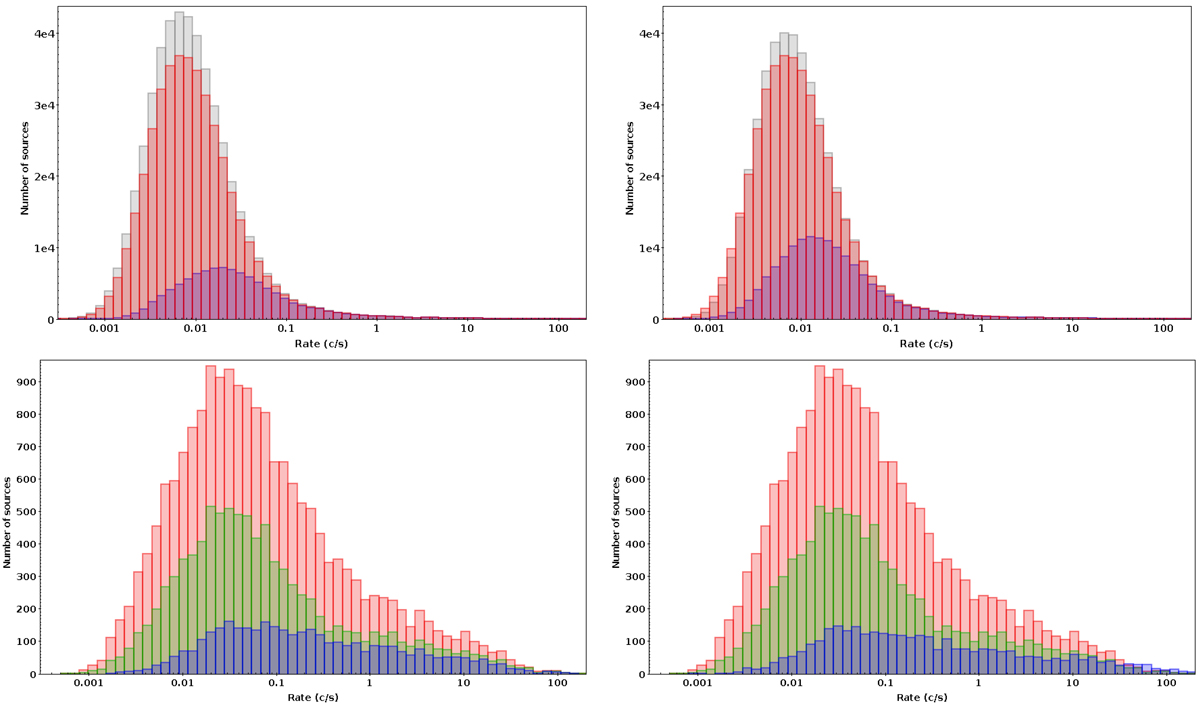
Top left: distribution in count rate of point-like sources characterised in the time domain. Red: EXTraS/STV analysis. Blue: 3XMM; the total source sample is shadowed. Top right: same as top left, EXTraS/STV vs. 4XMM. Bottom left: distribution in count rate of point-like sources displaying variability. Red: EXTraS/STV analysis (p-value p < 10−5, according to results of the fit of a constant model on 500 s or optimal time bin, or with more than one Bayesian block in the sensitive segmentation). Green: EXTraS/STV analysis, based on uniform bin light curves only. Blue: 3XMM timing analysis (p-value p < 10−5, according to results of the fit of a constant model). Bottom right: same as bottom left, EXTraS/STV vs. 4XMM. In all panels, all bar items start from the baseline.
Current usage metrics show cumulative count of Article Views (full-text article views including HTML views, PDF and ePub downloads, according to the available data) and Abstracts Views on Vision4Press platform.
Data correspond to usage on the plateform after 2015. The current usage metrics is available 48-96 hours after online publication and is updated daily on week days.
Initial download of the metrics may take a while.