Open Access
Fig. 15
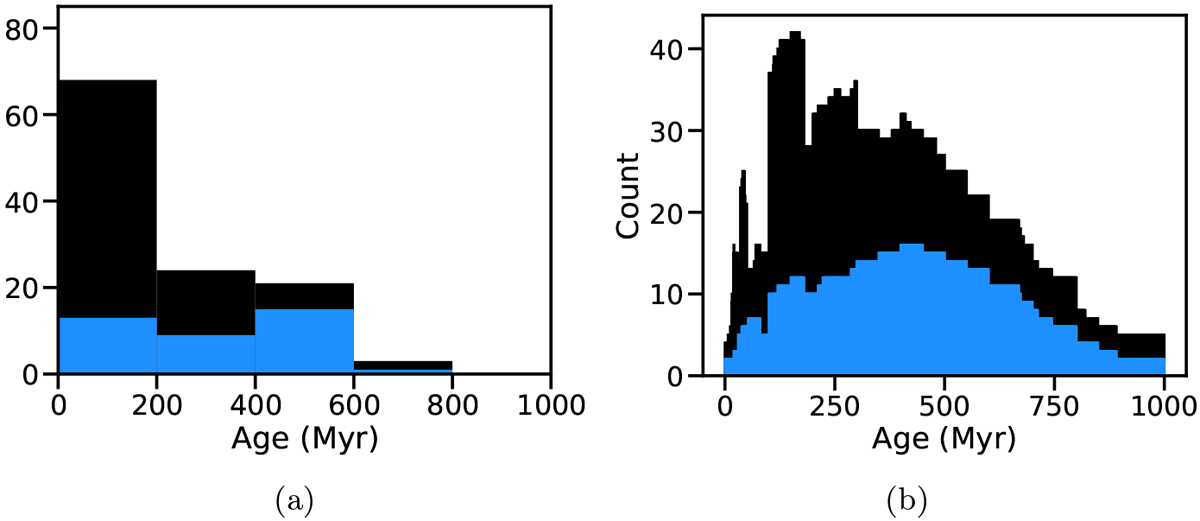
Age distribution of the combined HARPS and SOPHIE YNS sample. (a) Age histogram. (b) Histogram of the possible age. Each bin counts the number of stars for which the bin is within their age error bars. The HARPS (black) histogram and the SOPHIE (blue) histogram are stacked.
Current usage metrics show cumulative count of Article Views (full-text article views including HTML views, PDF and ePub downloads, according to the available data) and Abstracts Views on Vision4Press platform.
Data correspond to usage on the plateform after 2015. The current usage metrics is available 48-96 hours after online publication and is updated daily on week days.
Initial download of the metrics may take a while.