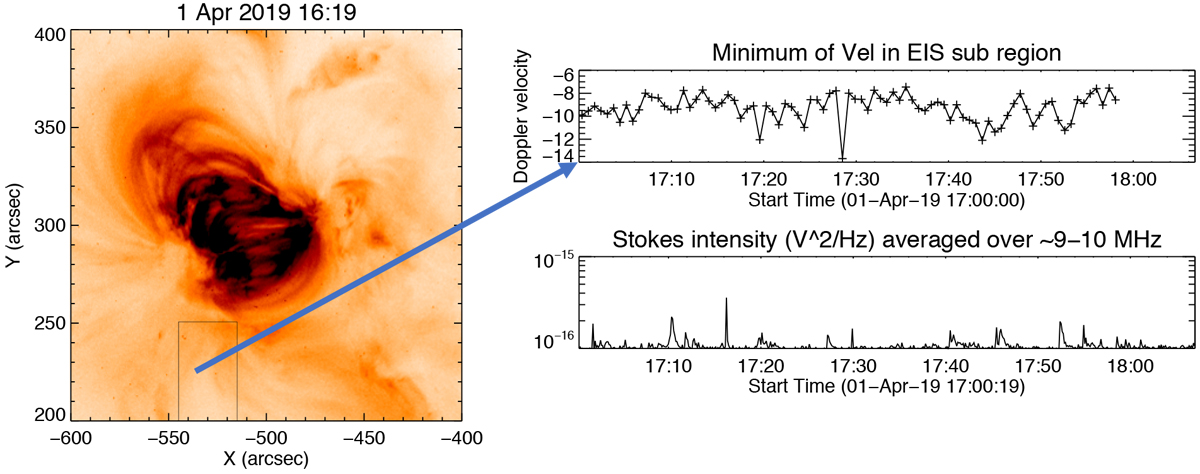
Fig. 8

Left panel: AIA 193 Å image with the field-of-view of the EIS fast scan overlaid. Within the EIS raster we chose a small regionof interest focused in the blue-shifted region. A blue arrow highlights this region of interest. Right panel, top: variation of the Doppler velocity during the one-hour raster. Bottom: variations in the PSP data and the frequency of the type III bursts for the same time interval.
Current usage metrics show cumulative count of Article Views (full-text article views including HTML views, PDF and ePub downloads, according to the available data) and Abstracts Views on Vision4Press platform.
Data correspond to usage on the plateform after 2015. The current usage metrics is available 48-96 hours after online publication and is updated daily on week days.
Initial download of the metrics may take a while.


