Fig. 1

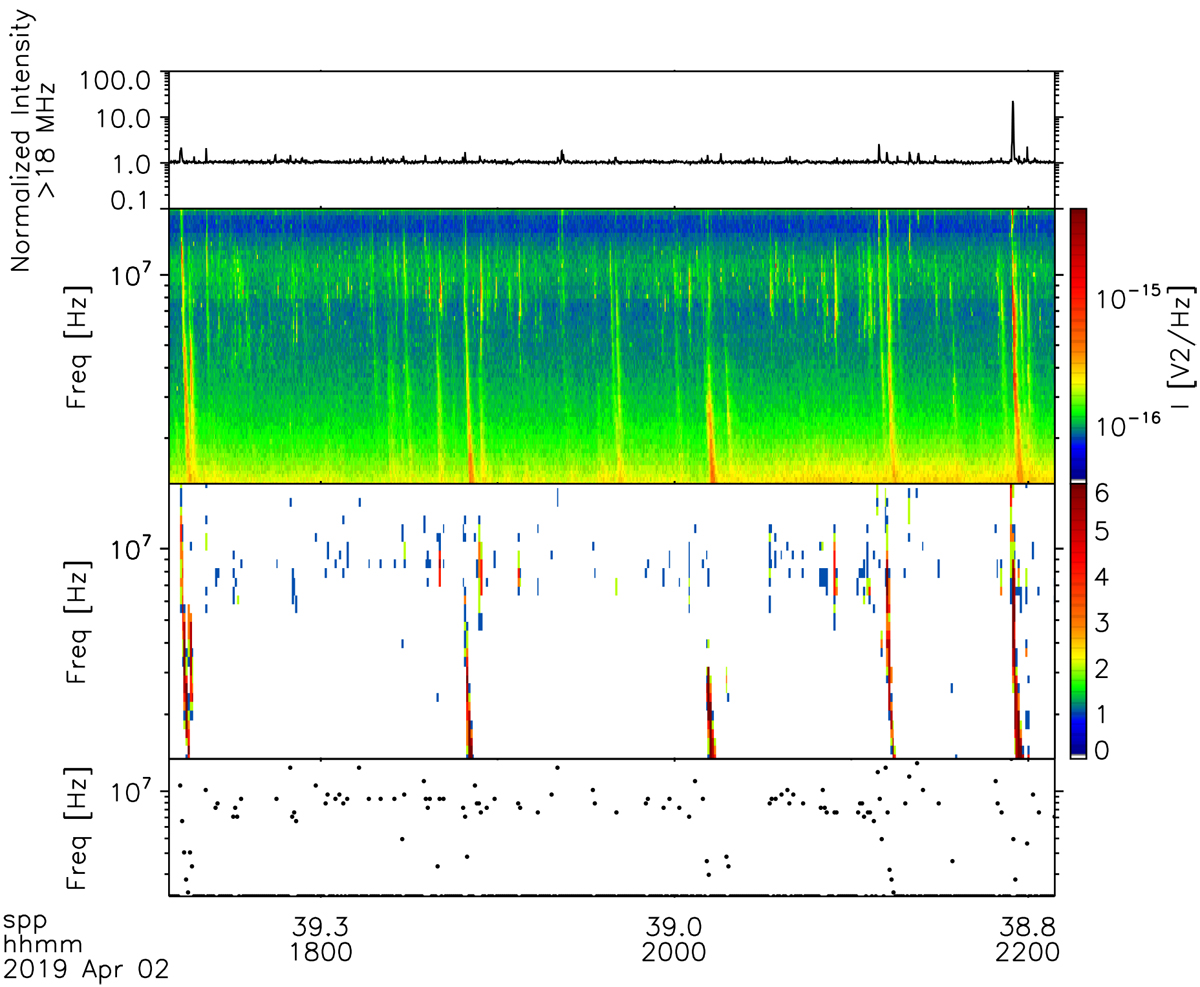
PSP/RFS, RSTN, and MWA radio frequency measurements, AIA 193 Å intensity, and GOES X-ray data over the full interval from 30 March 2019 to 6 April 2019. Top panel: daily RSTN flux from 30 March to 6 April 2019 at 245 MHz. The red circle marks the flux at 240 MHz obtained from the MWA flux calibration, with error bars from the temporal RMS each day. Second panel: GOES soft X-ray flux data, which do not show any significant flares. Third panel: AIA 193 Å intensity integrated over the FOV shown in Fig. 3, showing the growth and flattening off of the development of the AR from 31 March to 4 April. Fourth panel: again the normalised Stokes intensity above 18 MHz and fifth panel: again the full spectrogram. Sixth panel: frequency of the peak normalised signal (as per Fig. 2). Bottom panel: inferred source height of the radio emission, inverting the peak frequency from a solar wind density profile and fundamental emission, as described in the text. The noise storm commenced on 31 March and a clear trend between 1 April to 4 April shows the peak type III storm emission frequency decreasing, corresponding to a higher source altitude or a more rarefied source region.
Current usage metrics show cumulative count of Article Views (full-text article views including HTML views, PDF and ePub downloads, according to the available data) and Abstracts Views on Vision4Press platform.
Data correspond to usage on the plateform after 2015. The current usage metrics is available 48-96 hours after online publication and is updated daily on week days.
Initial download of the metrics may take a while.


