Fig. 6
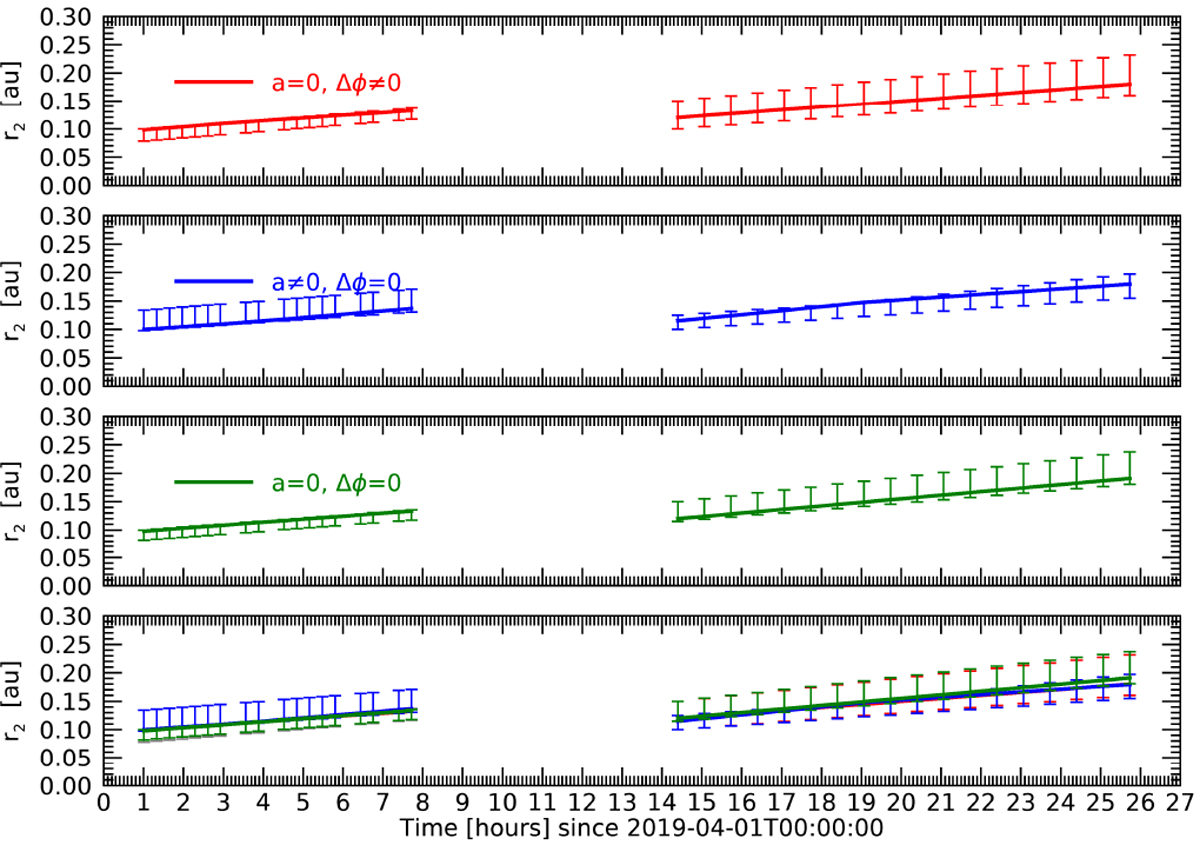
CME #1 position r2[t] derived by SSFs. The continuous lines show the median values, and the error bars indicate the minimum and maximum values. Each color represents a fit with a different set of free parameters, which is indicated in each panel. All plots shown in the three upper panels are repeated in the bottom one to help compare the fits. The results from MSF are not shown.
Current usage metrics show cumulative count of Article Views (full-text article views including HTML views, PDF and ePub downloads, according to the available data) and Abstracts Views on Vision4Press platform.
Data correspond to usage on the plateform after 2015. The current usage metrics is available 48-96 hours after online publication and is updated daily on week days.
Initial download of the metrics may take a while.