Fig. 5
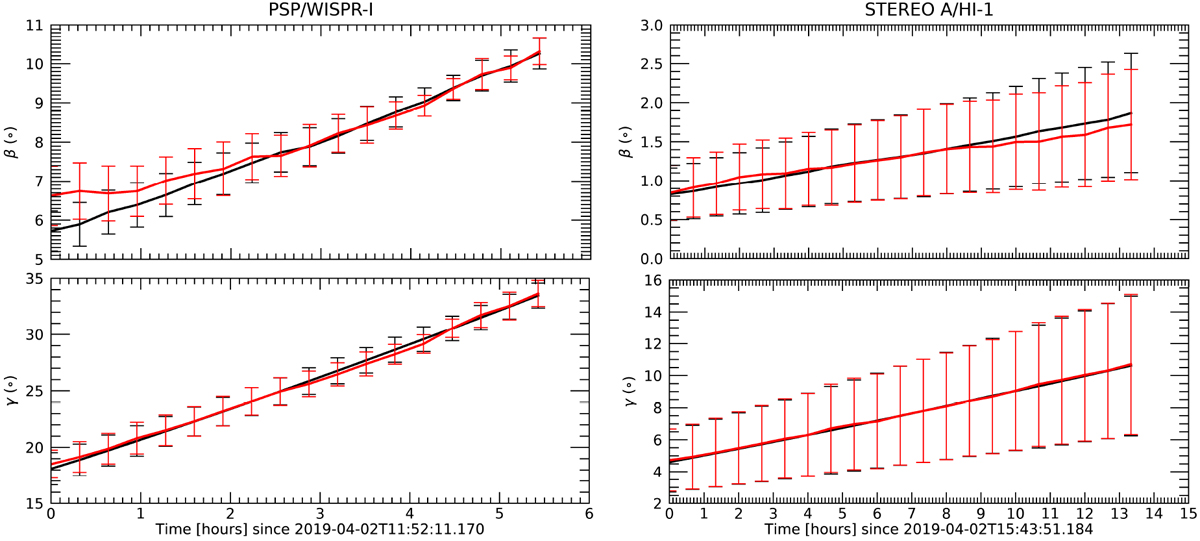
Comparison of the observed and calculated β and γ parameters as a function of time for the CME #2 using observations from WISPR-I (left panels) and HI-1 (right panels). The lines represent the median values, and the error bars correspond to the standard deviation calculated by repeating the fit with multiple sets of observations. The red lines indicate observations, and the black lines represent values calculated by the fit.
Current usage metrics show cumulative count of Article Views (full-text article views including HTML views, PDF and ePub downloads, according to the available data) and Abstracts Views on Vision4Press platform.
Data correspond to usage on the plateform after 2015. The current usage metrics is available 48-96 hours after online publication and is updated daily on week days.
Initial download of the metrics may take a while.