Fig. 2
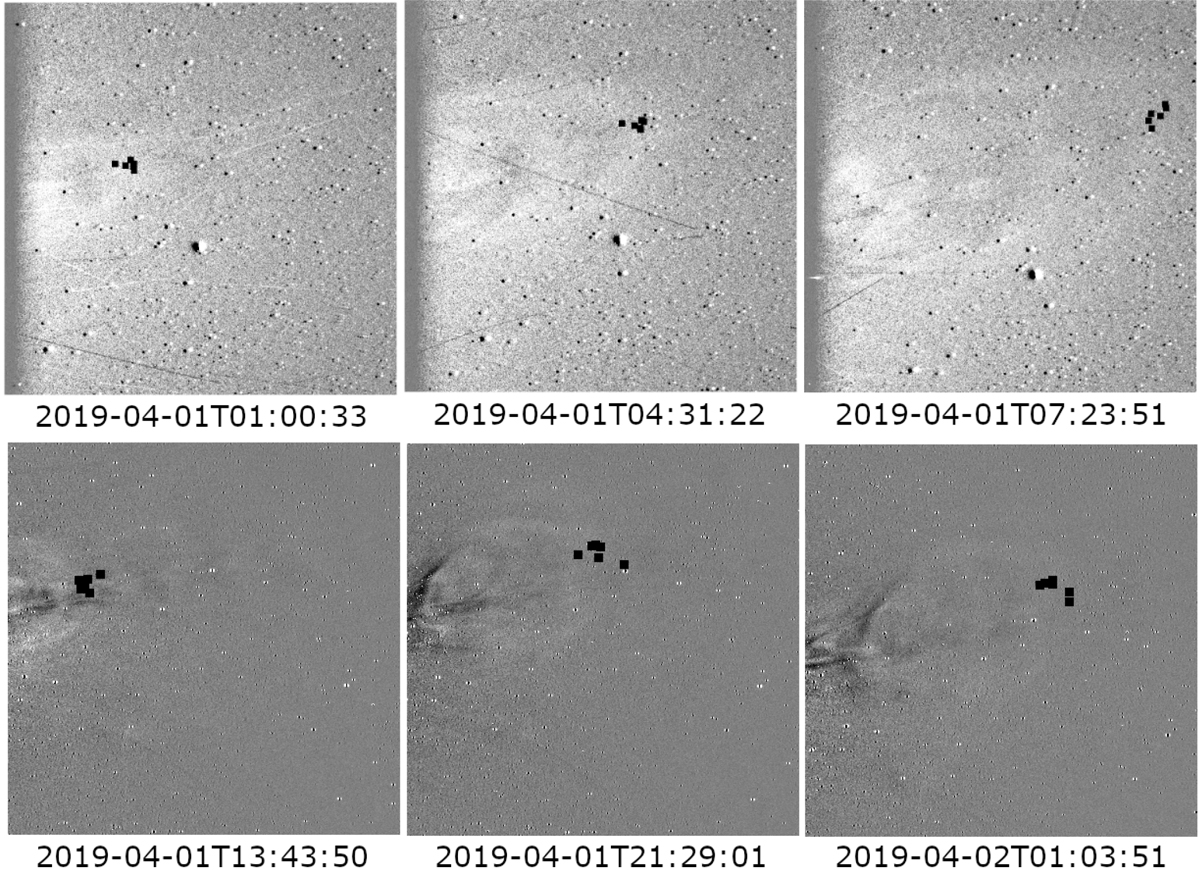
Coronal mass ejection observed on April 1, 2019 by the WISPR-I (upper row) imager onboard PSP and HI-1 onboard STEREO-A (lower row). Here, we display only three observations for each instrument, one close to the first observation (left column), another close to the center of the observation period (center column), and another close to the last observation (right column). All images shown here are running differences, and they are cropped to highlight the CME region. The six black squares in each frame represent the CME front point selected in each visual inspection (see details in Sect. 3).
Current usage metrics show cumulative count of Article Views (full-text article views including HTML views, PDF and ePub downloads, according to the available data) and Abstracts Views on Vision4Press platform.
Data correspond to usage on the plateform after 2015. The current usage metrics is available 48-96 hours after online publication and is updated daily on week days.
Initial download of the metrics may take a while.