Fig. 5.
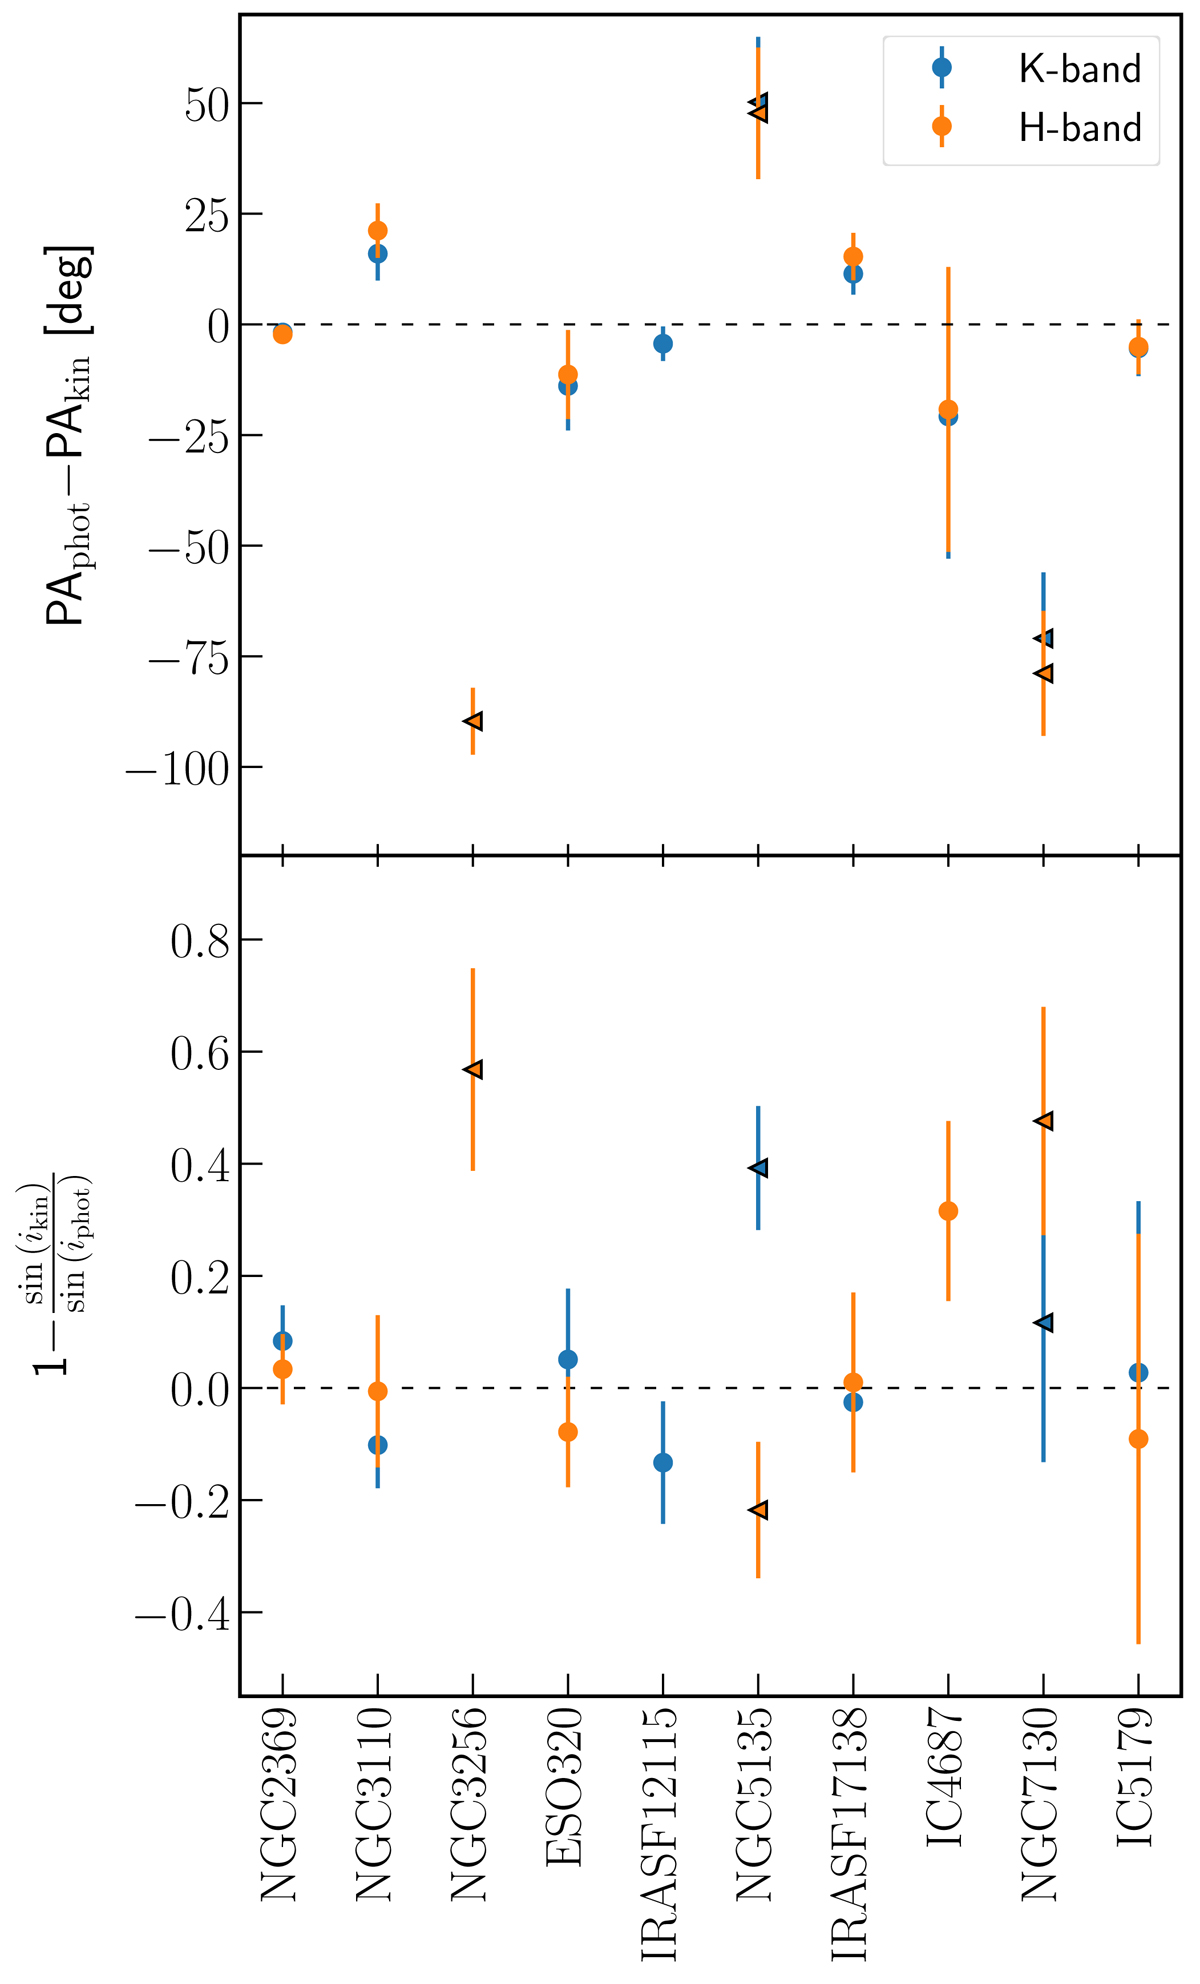
Comparison between the photometrically and kinematically derived parameters. The difference between the photometric (see Sect. 3.2) and the H- (in orange) and K-band (in blue) kinematic values (Sect. 4.2) for the PA and inclination, represented as the relative difference of sin(i), are displayed in the top and bottom panels, respectively. The galaxies represented by triangles with black borders are excluded in the subsequent analysis (see Sect. 4.3)
Current usage metrics show cumulative count of Article Views (full-text article views including HTML views, PDF and ePub downloads, according to the available data) and Abstracts Views on Vision4Press platform.
Data correspond to usage on the plateform after 2015. The current usage metrics is available 48-96 hours after online publication and is updated daily on week days.
Initial download of the metrics may take a while.