Fig. 4.
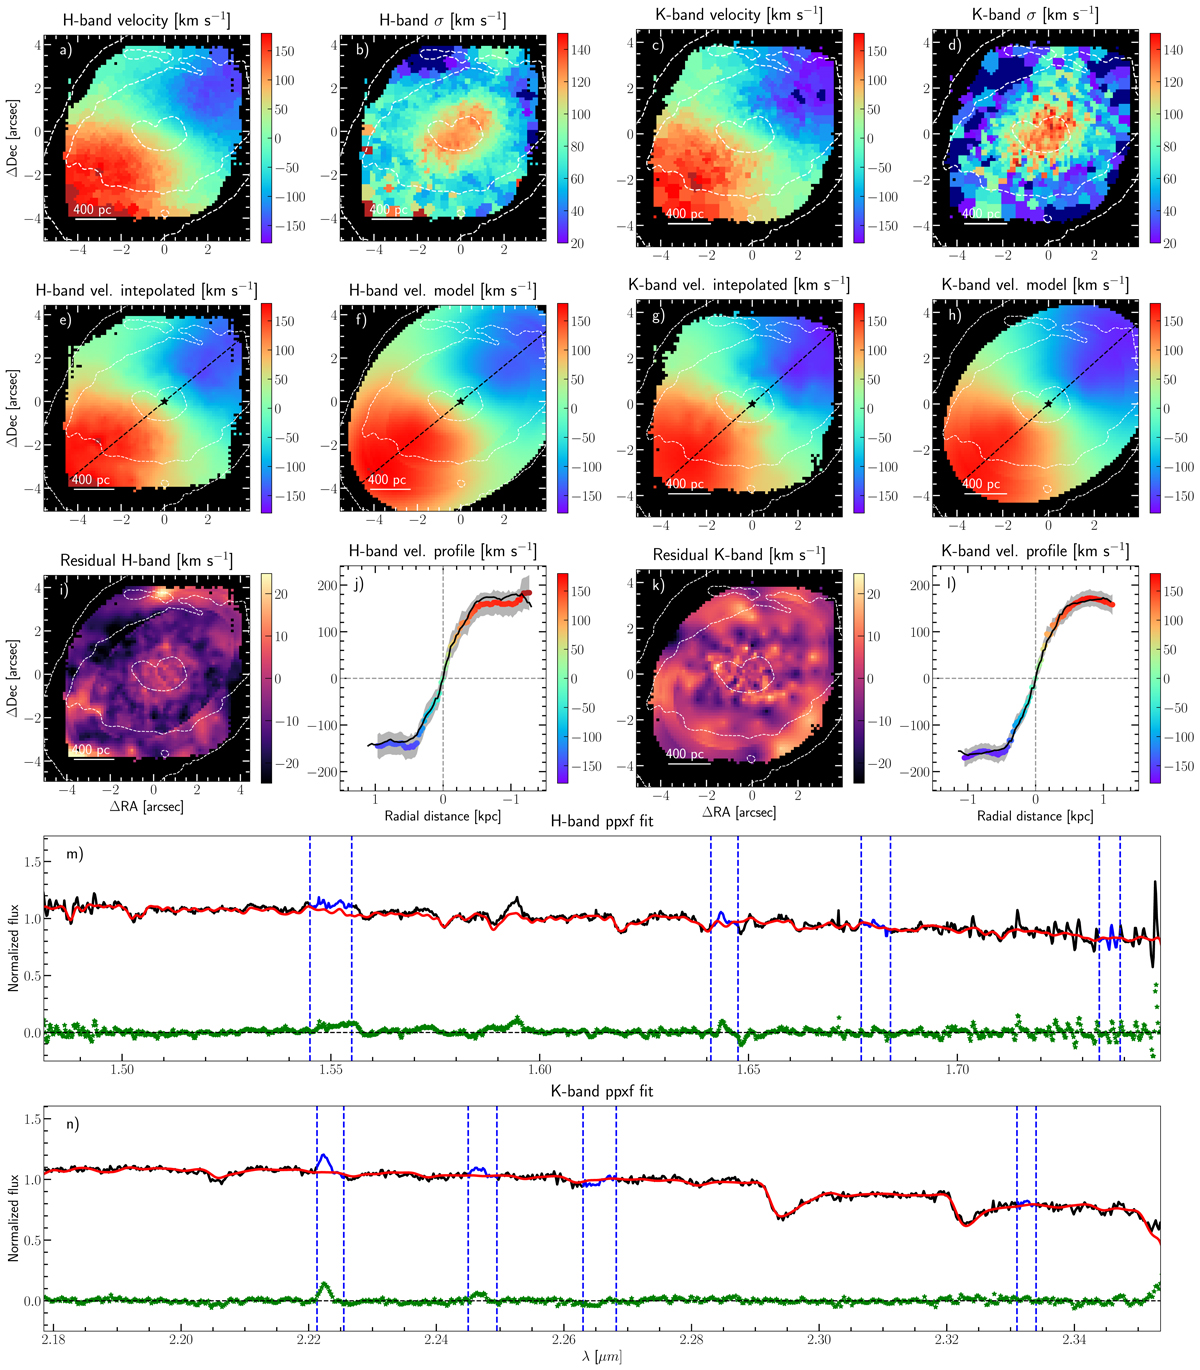
ESO 320-G030 kinematic results. Panels a and b (c and d) show the velocity and velocity dispersion maps extracted with pPXF for the H-band (K-band). The HST contours used in Fig. 3 are over-plotted here for reference. Panels e and f (g and h) display the interpolated velocity maps and the resulting DiskFit model for the H-band (K-band). The PA and kinematic centre extracted from these models are represented by a dashed line and a star, respectively. The residuals of each model are presented in panels i and k. The observed velocity profiles extracted along the major axis on the interpolated velocity maps are shown in panels j and l as coloured dots, whereas the grey areas delimit the 1σ confidence interval from their pPXF errors. In these panels, the modelled rotation curves are represented as black lines. Panel m (n) shows, as an example, the pPXF fit of the spectra of the H-band (K-band) kinematic centre. Black and red lines represent the normalised spectra and their best fit, with their residuals plotted as green dots. Blue dashed lines delimit the wavelength ranges excluded during the analysis because of the presence of emission lines (e.g., [Fe II] λ1.664 μm, Br11 λ1.681 μm, H2 1-0 S(0) λ2.224 μm, etc.), atmospheric lines, or strong residuals from the SINFONI ‘footprint’ (see Sect. 2.2).
Current usage metrics show cumulative count of Article Views (full-text article views including HTML views, PDF and ePub downloads, according to the available data) and Abstracts Views on Vision4Press platform.
Data correspond to usage on the plateform after 2015. The current usage metrics is available 48-96 hours after online publication and is updated daily on week days.
Initial download of the metrics may take a while.