Fig. D.2.
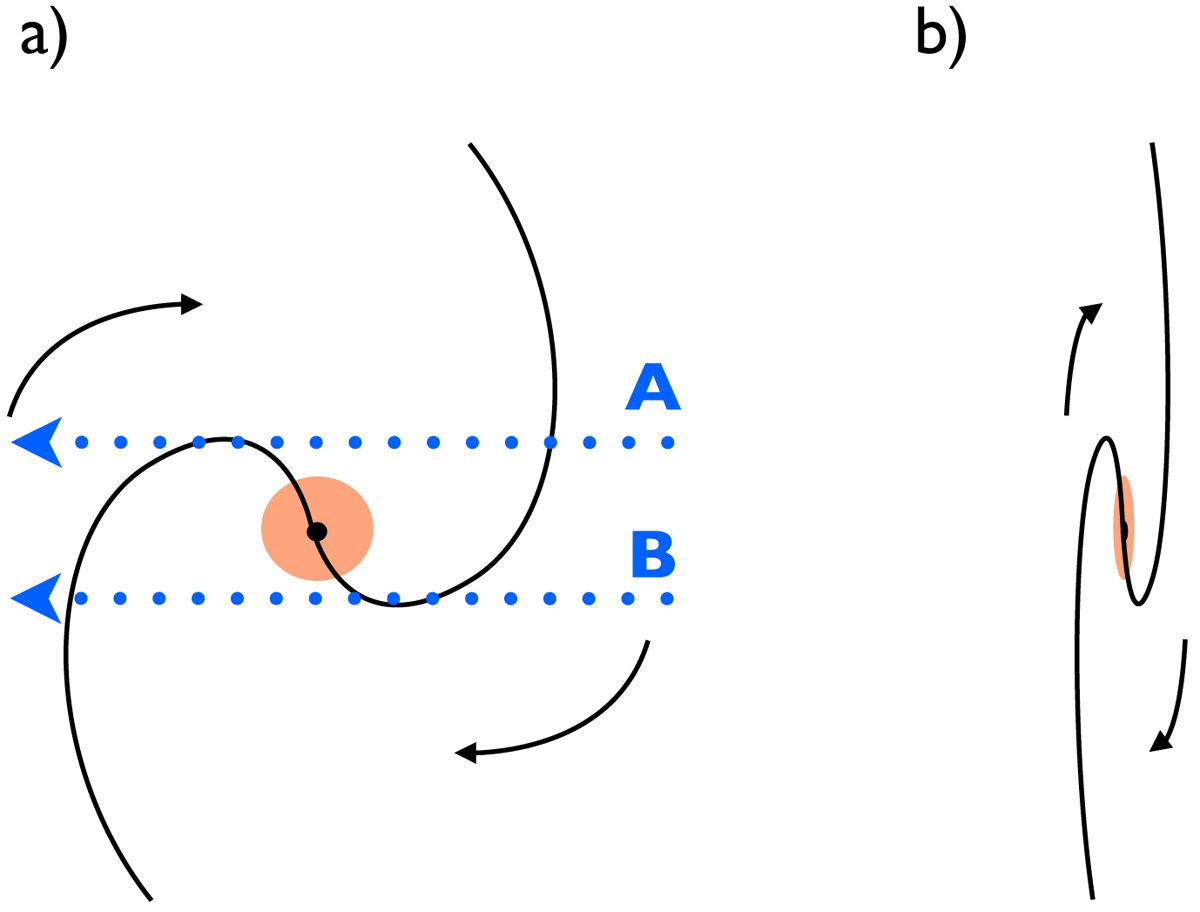
Sketch illustrating the scenario proposed for NGC 2369. Panel a: face-on representation of the galaxy, where the orange circle represent the highly obscured nuclear region of this object. Blue dotted lines display the LOS of the corresponding to the regions A and B from Fig. D.1. Panel b: representation of the galaxy orientation in the sky.
Current usage metrics show cumulative count of Article Views (full-text article views including HTML views, PDF and ePub downloads, according to the available data) and Abstracts Views on Vision4Press platform.
Data correspond to usage on the plateform after 2015. The current usage metrics is available 48-96 hours after online publication and is updated daily on week days.
Initial download of the metrics may take a while.