Fig. 11.
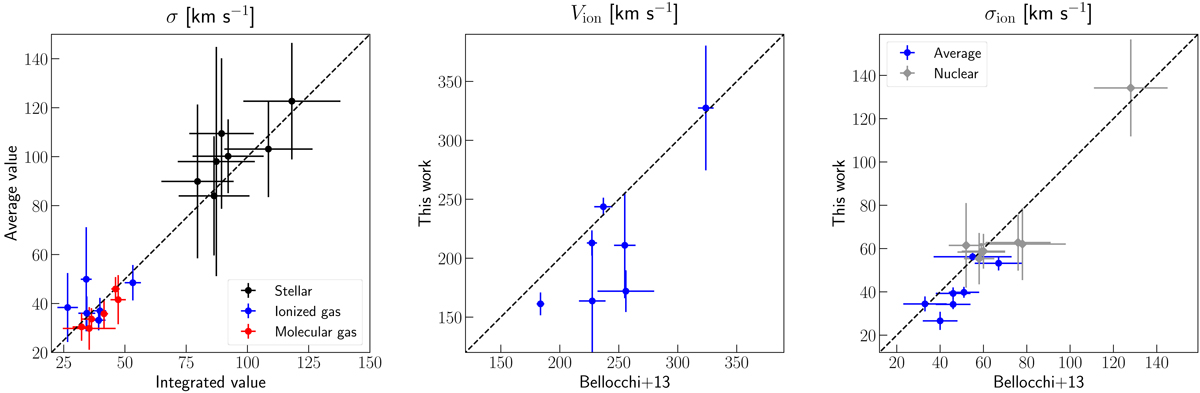
Left panel: uniformly weighted average and integrated aperture-smearing corrected velocity dispersion values obtained from the gas and stellar phases. For this comparison, we omitted the gas results of NGC 2369 because its σ values were not computed using the integrated spectra (see Table 5). Middle: inclination-corrected velocity amplitude for the ionised gas extracted in this work and in Bellocchi et al. (2013). We assumed the kinematically derived inclination extracted in this work (Table 4) to correct both the optical and near-IR observed velocities. Right panel: comparison between the average (blue) and nuclear (grey) velocity dispersion values extracted from optical and near-IR emission lines. Dashed lines represent the 1:1 relation.
Current usage metrics show cumulative count of Article Views (full-text article views including HTML views, PDF and ePub downloads, according to the available data) and Abstracts Views on Vision4Press platform.
Data correspond to usage on the plateform after 2015. The current usage metrics is available 48-96 hours after online publication and is updated daily on week days.
Initial download of the metrics may take a while.