Fig. 10.
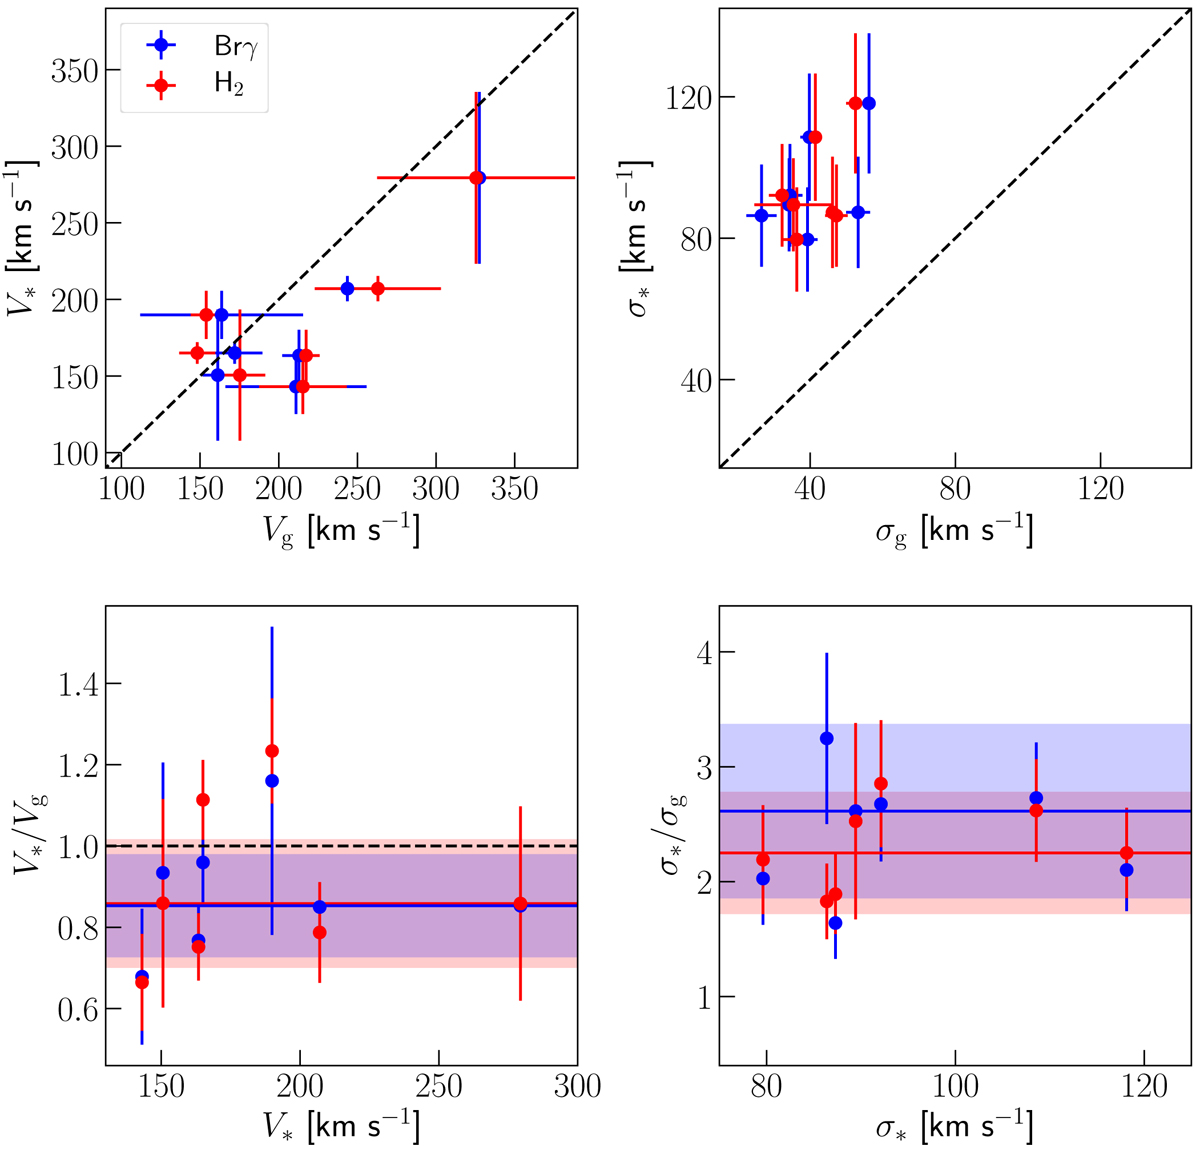
Gas and stellar kinematic results. Comparison between the stellar and gas (ionised and molecular in blue and red, respectively) inclination-corrected velocity amplitude (upper left panel) and velocity dispersion (upper right panel) extracted in Sect. 4.3. Dashed lines represent the 1:1 relation. Lower left and right panel shows the ratio between the stellar and gas velocity and velocity dispersion as a function of their stellar values. Red and blue horizontal lines represent the mean values for the ionised and hot molecular phases, whereas the coloured areas represent the standard deviation of the values.
Current usage metrics show cumulative count of Article Views (full-text article views including HTML views, PDF and ePub downloads, according to the available data) and Abstracts Views on Vision4Press platform.
Data correspond to usage on the plateform after 2015. The current usage metrics is available 48-96 hours after online publication and is updated daily on week days.
Initial download of the metrics may take a while.